
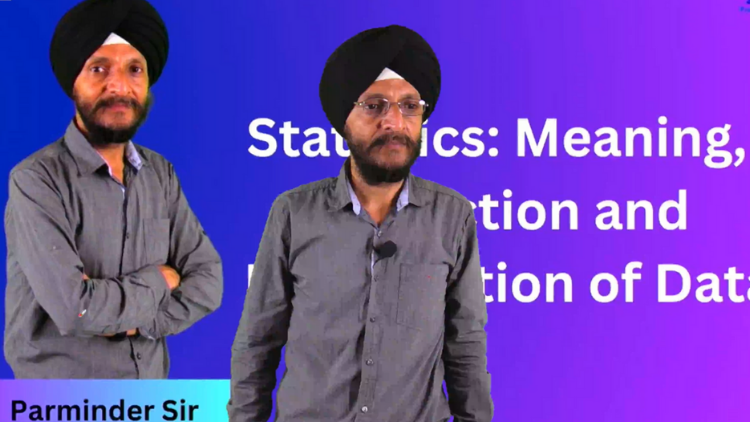
- What is the meaning of statistics?
- What is meant by data?
- What is difference between Primary data and Secondary data?
- What are the various ways and means to collect data?
- How we can present data with the help of tables?
- What are the various applications of statistics?
Estadísticas Desveladas: De la Recopilación de Datos a la Presentación
Всеосяжний посібник із розуміння та візуалізації інформації
Todos los niveles • 5 Lecciones • Acceso de por vida
Instructor Maestro Verificado
TRÁILER
Conoce a tu instructor: Prabh Kirpa Classes
19 ms
5.0 / 5.0
Calificación Global1
Estudiantes ActivosInglés estadounidense
Subtítulos en 99 idiomas37m
Contenido TotalLo que aprenderás
Що означає статистика?
Яка різниця між первинними та вторинними даними?
Які різні способи та засоби збору даних?
Як ми можемо представити дані за допомогою таблиць?
Contenido del curso
2 secciones • 5 lecciones • 00:37:27 duración totalConclusion
02:24
Collection of Data
06:01
- Give five examples of data that you can collect from your day-to-day life?
- What is the meaning of primary data?
- Primary Data can be collected through various methods. What are those?
- What is meant by Secondary data?
- Secondary data can be sourced or collected from various sources. What are those?
- What is the difference between Primary Data and Secondary data.
Presentation of Data
19:56
- What is the next step after the collection of data?
- What is meant by presentation of data?
- In which scenario, the presentation of data in ascending or descending order can be quite time consuming?
- What is meant by ungrouped frequency distribution table? Elaborate it with the help of an example.
- What is the meaning of grouped frequency distribution table? Elaborate it with the help of an example.
- A class of 50 students has been divided into two groups on the basis of weight of students i.e. 30-50kg. (30 students) and 51-70kg (20 students). Suppose a new student of 50.5 kg. gets admission. Draw the grouped frequency distribution table for the new scenario.
Meaning of Statistics
07:23
- From where we everyday get a lot of information in the form of facts, numerical figures, tables or graphs etc.
- What is the meaning of data?
- What is the name of branch of mathematics where the extraction of meaningful information from data is studied?
- The word “statistics” has different meanings in different contexts. Elaborate.
Plan de Estudio Semanal
Planifica tu aprendizaje
La IA genera un horario personalizado según tu disponibilidad5 hrs/semana
Requisitos
Базове знання алгебри та геометричних понять
A quién va dirigido
Students and any individual who enjoys learning about various mathematical concept
Acerca de este curso
Статистика використовується в різних галузях. Коментуйте.
Conoce a tu instructor
Prabh Kirpa Classes
Instructor Principal
Educator
This channel is purely education based. Our aim is to ensure that the students are able to understand each and every question in an easy way. We take pride in providing quality educational services to the students of Class VII to Class XI Science NCERT, English, Computer solutions, Mathematics, Business Studies & Economics. Our goal is to help the leaders of tomorrow to learn to succeed today....
Más cursos de
Prabh Kirpa ClassesLos estudiantes también compraron
Los estudiantes que vieron este curso también se inscribieron en estos cursos mejor calificados
Enseñanza y Academia | Ingeniería
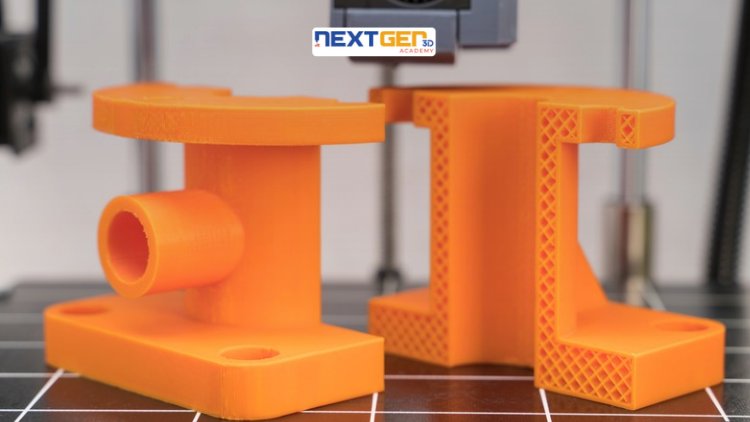
Unlock the world of 3D printing and product creation with a hands-on, industry-focused course designed to turn your ideas into reality. Whether you’re an engineer, designer, technician Masterclass.
5.0
3h
19 clases
Intermedio
$12.99

Enseñanza y Academia | Matemáticas
Taking Your Mastery of Probability to the Next Level
5.0
1h 30m
6 clases
Todos
$9.99
$19.99
Enseñanza y Academia | Matemáticas
Advanced Formulas and Strategies for Cone Surface Area Determination
5.0
1h
10 clases
Todos
$19.99
GRATIS

Enseñanza y Academia | Asuntos actuales
Master all important Current Affairs from June 1–30, 2026 with daily video lectures, MCQs, exam-oriented explanations an
5.0
8h 30m
29 clases
Principiante
$29.99
$39.99
Enseñanza y Academia | Matemáticas
Unlocking the Power of Bar Charts for Effective Data Communication
5.0
1h
5 clases
Todos
$14.99
$19.99
Frequently Bought Together
Learners who enrolled in this course also frequently purchased these complementary courses together.
7-Day Money Back Guarantee for all bundle items
Total price for selected items:
$42.38
$52.97
Preguntas frecuentes
Encuentre respuestas a las preguntas más comunes sobre este curso.
¡Sí! Al completar el 100% de las conferencias y tareas del curso, podrá descargar instantáneamente su Certificado de finalización digital verificado directamente desde su perfil de Lucebra.
Explorar más en Technology
Amplía tu aprendizaje con certificados acreditados, libros digitales relacionados y clases interactivas en vivo.