
After going through this course, the students will understand:
if a survey is conducted to find out the causes of illness and death among women, then how to represent the survey figures in the form of a graph.
if the data on the number of girls per thousand boys in different sections of the society is given, then how to represent the information given by way of a bar graph.
If the data in respect of seats won by different political parties in polling outcome of state assembly elections is given, then how to draw the bar graph to represent the polling results.
Stapelgrafer Avslöjade: En Omfattande Introduktion
Låser Upp Kraften i Stapeldiagram för Effektiv Datakommunikation
تمام سطحیں • 6 لیکچرز • زندگی بھر رسائی
تصدیق شدہ ماسٹر انسٹرکٹر
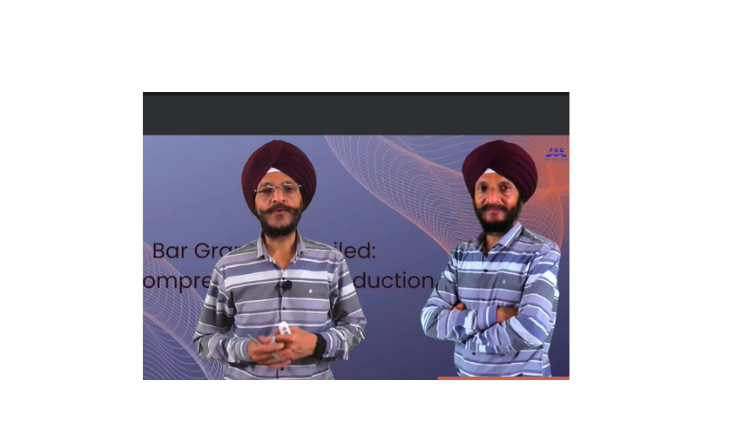
ٹریلر
اپنے انسٹرکٹر سے ملیں: Prabh Kirpa Classes
19 ms
5.0 / 5.0
عالمی درجہ بندی1
فعال طلباءامریکی انگریزی
99 زبانوں کے سب ٹائٹلز59 منٹ
کل موادجو آپ سیکھیں گے۔
Om en undersökning genomförs för att ta reda på orsakerna till sjukdom och död bland kvinnor, hur ska man då representera undersökningssiffrorna i form av ett diagram.
Om data om antalet flickor per tusen pojkar i olika delar av samhället ges, hur ska man då representera den information som ges genom ett stapeldiagram.
Om data om antalet mandat som vunnits av olika politiska partier i resultatet av delstatsval ges, hur ska man då rita stapelgrafen.
Om staplar i stapelgrafen dras vertikalt eller horisontellt?
کورس کا مواد
2 حصے • 6 لیکچرز • 00:59:22 کل لمبائیConclusion
01:18
- Why Bar graph or Bar Chart is used?
- Whether bars in the bar graph are drawn vertically or horizontally?
- Whether any space is left between bars?
- Whether each bar in the bar graph has an equal width?
- Whether bars in the bar graph are adjoining to each other?
- Whether bar graphs are simple or complex to understand?
Bar Graph: Polling results
09:09
If the data in respect of seats won by different political parties in polling outcome of state assembly elections is given, then how to draw the bar graph to represent the polling results.
Graph: Number of girls per thousand boys
15:47
If the data on the number of girls per thousand boys in different sections of the society is given, then how to represent the information given by way of a bar graph and what conclusions can be arrived at from the graph.
Bar Graph: Causes of illness and Death
14:32
If a survey is conducted to find out the causes of illness and death among women, then how to represent the survey figures in the form of a graph and to find out which condition is the major cause of women’s ill health and death worldwide.
Bar Graph: Causes of illness and Death
14:32
If a survey is conducted to find out the causes of illness and death among women, then how to represent the survey figures in the form of a graph and to find out which condition is the major cause of women’s ill health and death worldwide.
ہفتاوار مطالعہ پلان
اپنا سیکھنا پلان بنائیں
AI آپ کی دستیابی کے مطابق شیڈول بناتا ہے5 گھنٹے/ہفتہ
تقاضے
Grundläggande kunskaper i Algebra och Geometriska begrepp
ہدفی سامعین
Students and any individual who enjoys learning about various mathematical concepts
اس کورس کے بارے میں
Efter insamlingen av data måste data presenteras på ett sätt som är lätt att förstå. För att presentera data kan vi använda olika metoder som frekvensfordeltabeller, stapelgrafer etc.
اپنے استاد سے ملیں
Prabh Kirpa Classes
مین انسٹرکٹر
Educator
This channel is purely education based. Our aim is to ensure that the students are able to understand each and every question in an easy way. We take pride in providing quality educational services to the students of Class VII to Class XI Science NCERT, English, Computer solutions, Mathematics, Business Studies & Economics. Our goal is to help the leaders of tomorrow to learn to succeed today....
انسٹرکٹر کے دیگر کورسز:
Prabh Kirpa Classesطلباء نے بھی خریداری کی۔
اس کورس کو دیکھنے والے سیکھنے والوں نے بھی ان اعلیٰ درجہ کے کورسز میں داخلہ لیا۔
تدریس اور اکیڈمکس | انجینئرنگ
Unlock the world of 3D printing and product creation with a hands-on, industry-focused course designed to turn your ideas into reality. Whether you’re an engineer, designer, technician Masterclass.
5.0
3 گھنٹے
19 لیکچرز
انٹرمیڈیٹ
$12.99
تدریس اور اکیڈمکس | ریاضی
Taking Your Mastery of Probability to the Next Level
5.0
1 گھنٹے 30 منٹ
6 لیکچرز
سب
$9.99
$19.99
تدریس اور اکیڈمکس | ریاضی
Advanced Formulas and Strategies for Cone Surface Area Determination
5.0
1 گھنٹے
10 لیکچرز
سب
$19.99
مفت
تدریس اور اکیڈمکس | انگریزی گرامر
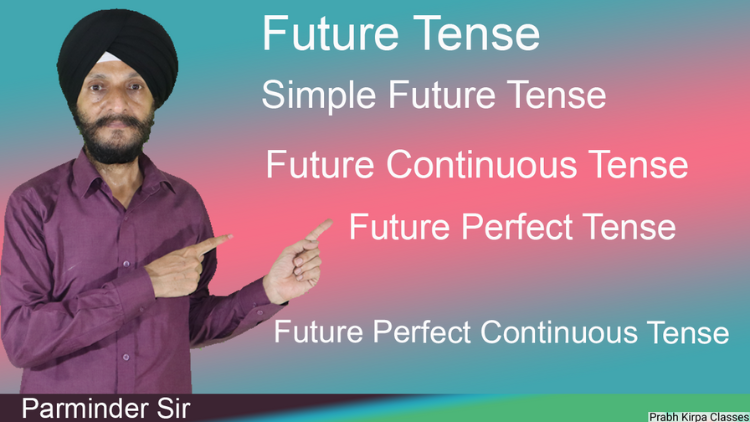
FUTURE TENSE
5.0
2 گھنٹے
4 لیکچرز
سب

تدریس اور اکیڈمکس | کرنٹ افیئرز
Master all important Current Affairs from June 1–30, 2026 with daily video lectures, MCQs, exam-oriented explanations an
5.0
8 گھنٹے 30 منٹ
29 لیکچرز
مبتدی
$29.99
$39.99
تدریس اور اکیڈمکس | ریاضی
Unlocking the Power of Bar Charts for Effective Data Communication
5.0
1 گھنٹے
5 لیکچرز
سب
$14.99
$19.99
Frequently Bought Together
Learners who enrolled in this course also frequently purchased these complementary courses together.
7-Day Money Back Guarantee for all bundle items
Total price for selected items:
$42.38
$52.97
اکثر پوچھے گئے سوالات
اس کورس کے بارے میں سب سے عام سوالات کے جوابات تلاش کریں۔
جی ہاں! کورس کے لیکچرز اور اسائنمنٹس کا 100% مکمل کرنے پر، آپ فوری طور پر اپنے لوسیبرا پروفائل سے اپنے تصدیق شدہ ڈیجیٹل سرٹیفکیٹ آف کمپلیشن کو فوری طور پر ڈاؤن لوڈ کر سکتے ہیں۔
Technology میں مزید دریافت کریں
تصدیق شدہ اسناد، متعلقہ ای بکس اور لائیو انٹرایکٹو کلاسز کے ساتھ اپنے تعلیمی سفر کو وسعت دیں۔