
After going through this course, the students will understand:
if a survey is conducted to find out the causes of illness and death among women, then how to represent the survey figures in the form of a graph.
if the data on the number of girls per thousand boys in different sections of the society is given, then how to represent the information given by way of a bar graph.
If the data in respect of seats won by different political parties in polling outcome of state assembly elections is given, then how to draw the bar graph to represent the polling results.
Säulendiagramme Enthüllt: Eine Umfassende Einführung
Die Kraft von Säulendiagrammen für effektive Datenkommunikation freisetzen
Barcha darajalar • 6 Ma'ruzalar • Umrbod kirish
Tasdiqlangan usta o'qituvchi
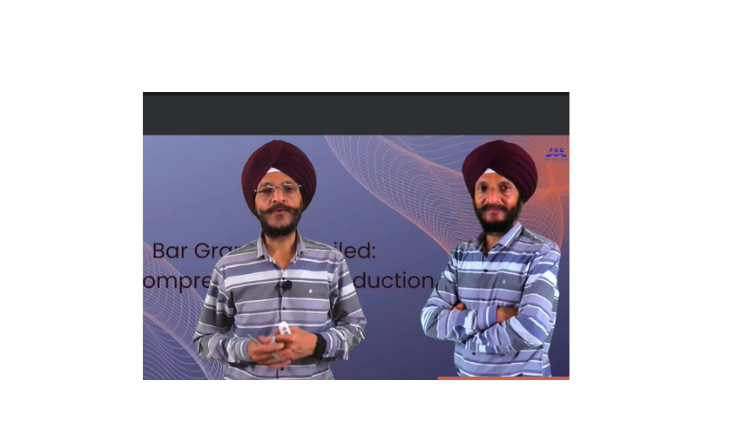
TREYLER
O'qituvchi bilan tanishing: Prabh Kirpa Classes
19 ms
5.0 / 5.0
Global reyting1
Faol talabalarIngliz (Amerika)
99 ta til subtitrlari59 daq
Jami tarkibSiz nimani o'rganasiz
Wenn eine Umfrage durchgeführt wird, um die Ursachen von Krankheiten und Todesfällen bei Frauen herauszufinden, wie kann man dann die Umfragezahlen in Form eines Diagramms darstellen.
Wenn die Daten über die Anzahl der Mädchen pro tausend Jungen in verschiedenen Gesellschaftsschichten gegeben sind, wie kann man dann die gegebenen Informationen durch ein Säulendiagramm darstellen.
Wenn die Daten bezüglich der von verschiedenen politischen Parteien gewonnenen Sitze im Wahlergebnis der Landesparlamentswahlen gegeben sind, wie kann man dann das Säulendiagramm zeichnen.
Ob die Balken im Säulendiagramm vertikal oder horizontal gezeichnet werden?
Kurs mazmuni
2 bo'limlar • 6 ma'ruzalar • 00:59:22 umumiy uzunligiConclusion
01:18
- Why Bar graph or Bar Chart is used?
- Whether bars in the bar graph are drawn vertically or horizontally?
- Whether any space is left between bars?
- Whether each bar in the bar graph has an equal width?
- Whether bars in the bar graph are adjoining to each other?
- Whether bar graphs are simple or complex to understand?
Bar Graph: Polling results
09:09
If the data in respect of seats won by different political parties in polling outcome of state assembly elections is given, then how to draw the bar graph to represent the polling results.
Graph: Number of girls per thousand boys
15:47
If the data on the number of girls per thousand boys in different sections of the society is given, then how to represent the information given by way of a bar graph and what conclusions can be arrived at from the graph.
Bar Graph: Causes of illness and Death
14:32
If a survey is conducted to find out the causes of illness and death among women, then how to represent the survey figures in the form of a graph and to find out which condition is the major cause of women’s ill health and death worldwide.
Bar Graph: Causes of illness and Death
14:32
If a survey is conducted to find out the causes of illness and death among women, then how to represent the survey figures in the form of a graph and to find out which condition is the major cause of women’s ill health and death worldwide.
Haftalik Oquv Rejasi
Oquv sayohatingizni rejalashtiring
SI vaqtingizga mos shaxsiy jadval yaratadi5 soat/hafta
Talablar
Grundlegende Kenntnisse in Algebra und Geometrie
Maqsadli auditoriya
Students and any individual who enjoys learning about various mathematical concepts
Ushbu kurs haqida
Nach der Datensammlung müssen die Daten so präsentiert werden, dass sie leicht verständlich sind. Um Daten zu präsentieren, können wir verschiedene Methoden wie Häufigkeitsverteilungstabellen, Säulendiagramme usw. verwenden.
Karyera imkoniyatlari va maqsadli kasblar
Amaliy va ishga tayyor ko'nikmalarni egallab, xalqaro miqyosdagi nufuzli lavozimlarga ariza topshiring
Ishga tayyor o'quv dasturi
Ariza topshirishingiz mumkin bo'lgan lavozimlar
People Operations Lead
Technical Talent Acquisition Specialist
HR Business Partner (HRBP)
Organizational Development Consultant
Taxminiy yillik maosh
$72,000 – $118,000 / yr
Global bozor talabi
Steady Global Corporate Demand
Siz egallaydigan asosiy ko'nikmalar* Baholar global texnologiya bozori va maosh hisobotlariga asoslangan.
Modern Talent Sourcing & Screening
Performance Appraisal Frameworks
Labor Law & Workplace Compliance
Employee Retention & Culture Strategy
O'qituvchingiz bilan tanishing
Prabh Kirpa Classes
Bosh murabbiy
Educator
This channel is purely education based. Our aim is to ensure that the students are able to understand each and every question in an easy way. We take pride in providing quality educational services to the students of Class VII to Class XI Science NCERT, English, Computer solutions, Mathematics, Business Studies & Economics. Our goal is to help the leaders of tomorrow to learn to succeed today....
O'qituvchining boshqa kurslari:
Prabh Kirpa ClassesTalabalar ham sotib olishdi
Ushbu kursni ko'rgan o'quvchilar ham ushbu eng yuqori baholangan kurslarga yozilishdi
O'qitish va akademik fanlar | Muhandislik
Unlock the world of 3D printing and product creation with a hands-on, industry-focused course designed to turn your ideas into reality. Whether you’re an engineer, designer, technician Masterclass.
5.0
3 soat
19 Darslar
O'rta
$12.99
O'qitish va akademik fanlar | Matematika
Taking Your Mastery of Probability to the Next Level
5.0
1 soat 30 daq
6 Darslar
Hammasi
$9.99
$19.99
O'qitish va akademik fanlar | Matematika
Advanced Formulas and Strategies for Cone Surface Area Determination
5.0
1 soat
10 Darslar
Hammasi
$19.99
Bepul
O'qitish va akademik fanlar | Ingliz tili grammatikasiHozir yozilish
FUTURE TENSE
5.0
2 soat
4 Darslar
Hammasi
Bepul

O'qitish va akademik fanlar | Joriy ishlar
Master all important Current Affairs from June 1–30, 2026 with daily video lectures, MCQs, exam-oriented explanations an
5.0
8 soat 30 daq
29 Darslar
Boshlovchi
$29.99
$39.99
O'qitish va akademik fanlar | Matematika
Unlocking the Power of Bar Charts for Effective Data Communication
5.0
1 soat
5 Darslar
Hammasi
$14.99
$19.99
Frequently Bought Together
Learners who enrolled in this course also frequently purchased these complementary courses together.
7-Day Money Back Guarantee for all bundle items
Total price for selected items:
$42.38
$52.97
Tez-tez so'raladigan savollar
Ushbu kurs bo'yicha eng keng tarqalgan savollarga javob toping.
Ha! Upon completing 100% of the course lectures and assignments, you can instantly download your verified digital Certificate of Completion directly from your Lucebra profile.
Technology bo'yicha ko'proq bilib oling
Akkreditatsiyadan o'tgan sertifikatlar, elektron kitoblar va jonli darslar bilan bilimlaringizni oshiring.