
Lucebra
Lucebra Zakelijk

Histograms en Frequentiepolygonen Ontrafeld

Понимание и Создание Визуальных Представлений Частоты Данных

Alle niveaus • 5 Lezingen • Levenslange Toegang
Prabh Kirpa Classes

Geverifieerde Master Instructeur

Разгадка Гистограмм и Частотных Многоугольников
AANHANGWAGEN
Maak kennis met je instructeur: Prabh Kirpa Classes

19 ms

5.0 / 5.0
Globale beoordeling
1
Actieve studenten
Engels (Verenigde Staten)
99 Talen Ondertitels
1 uur 8 min
Totale inhoud

Wat je gaat leren

1. Если длина некоторых листьев растения измерена и данные представлены в виде таблицы с непрерывными классами интервалов, то как нарисовать гистограмму
2. Могут ли данные, использованные для рисования гистограммы, быть использованы для рисования любого другого подходящего графика.
3. Если данные о сроках службы некоторых неоновых ламп представлены в виде таблицы, как представить информацию с помощью гистограммы.
4. Если таблица показывает распределение учащихся в двух секциях по оценкам, которые они получили, то как использовать эти данные для создания двух частотных многоугольников

Cursusinhoud

2 secties • 5 lezingen • 01:08:37 totale lengte

Introduction

05:12
After going through this course, the students will understand:
  • if the length of some leaves of a plant is measured and the data is represented by a table having discontinuous class intervals, then how to draw a histogram for that data.
  • whether the data which is used to draw histogram, can be used to draw any other suitable graph.
  • if the data in respect of lifetimes of some neon lamps is given in the form of a table, how to represent the information with the help of a histogram.
  • if a table shows distribution of students in two sections according to the marks obtained by them, then how to use that data to form two frequency polygons on the same graph.
Histogram data: other option

15:13

Suppose we draw a histogram with the help of a table which is having data in the form of discontinuous class intervals. Whether there is any other suitable graphical representation for the same data.

Histogram : Life times of neon lamps

12:11

If the data in respect of lifetimes of some neon lamps is given in the form of a table, how to represent the information with the help of a histogram. How many lamps have a life time of more than specified hours?

Histogram: Length and number of leaves

20:00

If the length of some leaves of a plant is measured and the data is represented by a table having discontinuous class intervals, then how to draw a histogram for that data.

Frequency Polygon: Marks of students

15:58

If a table shows distribution of students in two sections according to the marks obtained by them, then how to use that data to form two frequency polygons on the same graph.
Wekelijks Studieplan
Plan je leertraject
AI genereert een gepersonaliseerd rooster op basis van je beschikbaarheid

Vereisten

Базовые знания алгебры и геометрических понятий

Doelgroep

Students and any individual who enjoys learning about various mathematical concepts

Over deze cursus

  • Если длина некоторых листьев растения измерена и данные представлены в виде таблицы с непрерывными классами интервалов, то как нарисовать гистограмму для этих данных.
  • Предположим, мы рисуем гистограмму с помощью таблицы, которая содержит данные в виде непрерывных класс-интервалов. Существует ли другое подходящее графическое представление для этих данных.
  • Если данные о сроках службы некоторых неоновых ламп представлены в виде таблицы, как представить информацию с помощью гистограммы. Сколько ламп имеют срок службы более указанных часов?
  • Если таблица показывает распределение учащихся в двух секциях по оценкам, которые они получили, то как использовать эти данные для создания двух частотных многоугольников на одном графике.
  • Когда необходимо представить большое количество данных, мы можем сжать данные в группы, и эти группировки называются “классы” или “класс-интервалы”, и их размер называется класс-размер или класс-ширина. В каждой из этих группировок/классов наименьшее число называется нижним класс-пределом, а большее число называется верхним класс-пределом. В случае гистограммы данные должны быть в виде непрерывных класс-интервалов. В случае частотного многоугольника необязательно, чтобы данные были в непрерывных класс-интервалах.
  • Maak kennis met je instructeur
    Prabh Kirpa Classes
    5.0 Beoordeling
    63 Studenten
    Bekijk volledig profiel
    Prabh Kirpa Classes
    Hoofdinstructeur
    Educator
    This channel is purely education based. Our aim is to ensure that the students are able to understand each and every question in an easy way. We take pride in providing quality educational services to the students of Class VII to Class XI Science NCERT, English, Computer solutions, Mathematics, Business Studies & Economics. Our goal is to help the leaders of tomorrow to learn to succeed today....
    Meer cursussen van
    Prabh Kirpa Classes

    Studenten kochten ook

    Studenten die deze cursus hebben bekeken, schreven zich ook in voor deze best beoordeelde cursussen

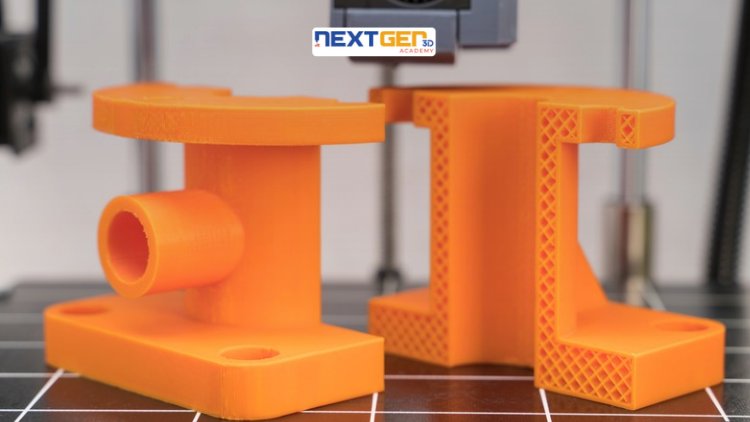
    3D Printing Failure Analysis: Root Cause & Diagnostics Masterclass
    Onderwijs en academici | Techniek

    Unlock the world of 3D printing and product creation with a hands-on, industry-focused course designed to turn your ideas into reality. Whether you’re an engineer, designer, technician Masterclass.

    5.0
    3 uur
    19 lezingen
    Tussenliggend
    $12.99
    Probability Beyond the Basics: Part 1
    Onderwijs en academici | Wiskunde

    Taking Your Mastery of Probability to the Next Level

    5.0
    1 uur 30 min
    6 lezingen
    Alles
    $9.99

    $19.99

    Beyond Basics: Calculating Cone Surface Area with Precision
    Onderwijs en academici | Wiskunde

    Advanced Formulas and Strategies for Cone Surface Area Determination

    5.0
    1 uur
    10 lezingen
    Alles
    $19.99
    Future Tense
    VRIJ
    Onderwijs en academici | Engelse grammatica

    FUTURE TENSE

    5.0
    2 uur
    4 lezingen
    Alles
    June 2026 Current Affairs Complete Revision Course
    Onderwijs en academici | Actuele zaken

    Master all important Current Affairs from June 1–30, 2026 with daily video lectures, MCQs, exam-oriented explanations an

    5.0
    8 uur 30 min
    29 lezingen
    Beginner
    $29.99

    $39.99

    Bar Graphs Unveiled: A Comprehensive Introduction
    Onderwijs en academici | Wiskunde

    Unlocking the Power of Bar Charts for Effective Data Communication

    5.0
    1 uur
    5 lezingen
    Alles
    $14.99

    $19.99

    Frequently Bought Together

    Learners who enrolled in this course also frequently purchased these complementary courses together.

    7-Day Money Back Guarantee for all bundle items

    Total price for selected items:

    $42.38

    $52.97

    🎉 Save 20% when bought together

    Veelgestelde vragen

    Vind antwoorden op de meest gestelde vragen over deze cursus.

    Ja! Nadat u 100% van de cursuslezingen en -opdrachten hebt voltooid, kunt u uw geverifieerde digitale certificaat van voltooiing direct downloaden vanuit uw Lucebra-profiel.

    Ontdek meer in Technology

    Breid je leertraject uit met geaccrediteerde certificaten, gerelateerde e-books en interactieve live lessen.