
After going through this course, the students will understand:
if a survey is conducted to find out the causes of illness and death among women, then how to represent the survey figures in the form of a graph.
if the data on the number of girls per thousand boys in different sections of the society is given, then how to represent the information given by way of a bar graph.
If the data in respect of seats won by different political parties in polling outcome of state assembly elections is given, then how to draw the bar graph to represent the polling results.
막대 그래프 밝히기: 종합 소개
효과적인 데이터 커뮤니케이션을 위한 막대 차트의 힘 잠금 해제
Alle Vlakke • 6 Lesings • Lewenslange Toegang
Geverifieerde Meester Instrukteur
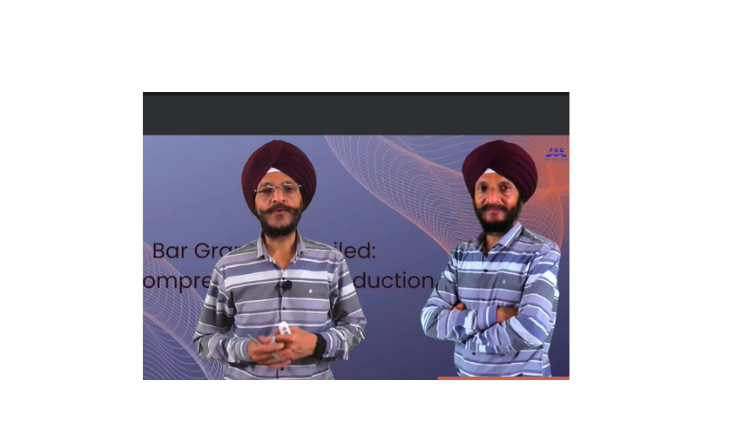
SLEEPWA
Ontmoet jou instrukteur: Prabh Kirpa Classes
19 ms
5.0 / 5.0
Globale gradering1
Aktiewe studenteEngels (Verenigde State van Amerika)
99 Tale Onderskrifte59 min
Totale inhoudWat jy sal leer
여성의 질병 및 사망 원인을 조사하기 위한 설문조사가 실시되었다면, 설문 조사 수치를 그래프 형식으로 어떻게 표현할 수 있는지 알아봅니다.
사회의 다른 부문에서 천 명의 남학생당 여학생 수에 대한 데이터가 주어진 경우, 주어진 정보를 막대 그래프로 어떻게 표현할 수 있는지 알아봅니다.
주 의회 선거 결과의 정당별 의석 수에 대한 데이터가 주어진 경우, 막대 그래프를 어떻게 그릴 수 있는지 알아봅니다.
막대 그래프의 막대는 수직으로 그려지나 혹은 수평으로 그려지나?
Kursusinhoud
2 afdelings • 6 lesings • 00:59:22 totale lengteConclusion
01:18
- Why Bar graph or Bar Chart is used?
- Whether bars in the bar graph are drawn vertically or horizontally?
- Whether any space is left between bars?
- Whether each bar in the bar graph has an equal width?
- Whether bars in the bar graph are adjoining to each other?
- Whether bar graphs are simple or complex to understand?
Bar Graph: Polling results
09:09
If the data in respect of seats won by different political parties in polling outcome of state assembly elections is given, then how to draw the bar graph to represent the polling results.
Graph: Number of girls per thousand boys
15:47
If the data on the number of girls per thousand boys in different sections of the society is given, then how to represent the information given by way of a bar graph and what conclusions can be arrived at from the graph.
Bar Graph: Causes of illness and Death
14:32
If a survey is conducted to find out the causes of illness and death among women, then how to represent the survey figures in the form of a graph and to find out which condition is the major cause of women’s ill health and death worldwide.
Bar Graph: Causes of illness and Death
14:32
If a survey is conducted to find out the causes of illness and death among women, then how to represent the survey figures in the form of a graph and to find out which condition is the major cause of women’s ill health and death worldwide.
Weeklikse Studieplan
Beplan jou leerreis
KI skep n persoonlike skedule gebaseer op jou beskikbaarheid5 ure/week
Vereistes
대수 및 기하학 개념에 대한 기본 지식
Teikengehoor
Students and any individual who enjoys learning about various mathematical concepts
Oor hierdie kursus
데이터 수집 후, 데이터는 쉽게 이해할 수 있는 방식으로 제시되어야 합니다. 데이터를 제시하기 위해 우리는 빈도 분포표, 막대 그래프 등 다양한 방법을 사용할 수 있습니다.
Ontmoet jou instrukteur
Prabh Kirpa Classes
Hoofinstrukteur
Educator
This channel is purely education based. Our aim is to ensure that the students are able to understand each and every question in an easy way. We take pride in providing quality educational services to the students of Class VII to Class XI Science NCERT, English, Computer solutions, Mathematics, Business Studies & Economics. Our goal is to help the leaders of tomorrow to learn to succeed today....
Meer kursusse deur
Prabh Kirpa ClassesStudente het ook gekoop
Leerders wat hierdie kursus bekyk het, het ook vir hierdie top-gegradeerde kursusse ingeskryf
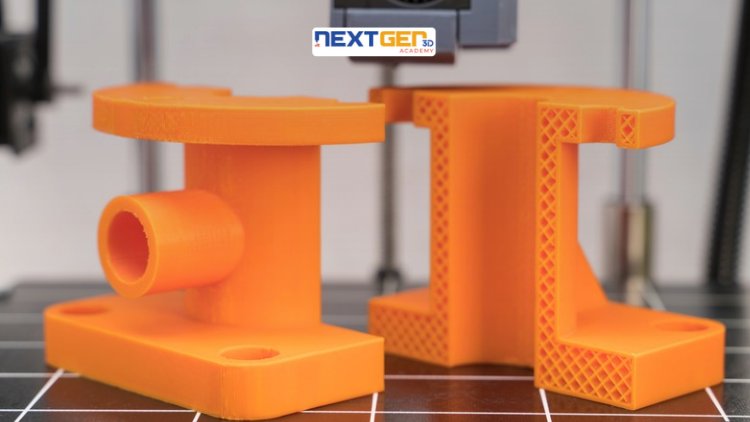
Onderrig en Akademies | Ingenieurswese
Unlock the world of 3D printing and product creation with a hands-on, industry-focused course designed to turn your ideas into reality. Whether you’re an engineer, designer, technician Masterclass.
5.0
3 uur
19 lesings
Intermediêr
$12.99
Onderrig en Akademies | Wiskunde
Taking Your Mastery of Probability to the Next Level
5.0
1 uur 30 min
6 lesings
Alles
$9.99
$19.99
Onderrig en Akademies | Wiskunde
Advanced Formulas and Strategies for Cone Surface Area Determination
5.0
1 uur
10 lesings
Alles
$19.99
GRATIS

Onderrig en Akademies | Aktuele sake
Master all important Current Affairs from June 1–30, 2026 with daily video lectures, MCQs, exam-oriented explanations an
5.0
8 uur 30 min
29 lesings
Beginner
$29.99
$39.99
Onderrig en Akademies | Wiskunde
Unlocking the Power of Bar Charts for Effective Data Communication
5.0
1 uur
5 lesings
Alles
$14.99
$19.99
Frequently Bought Together
Learners who enrolled in this course also frequently purchased these complementary courses together.
7-Day Money Back Guarantee for all bundle items
Total price for selected items:
$42.38
$52.97
Gereelde Vrae
Vind antwoorde op die mees algemene vrae oor hierdie kursus.
Ja! Nadat u 100% van die kursuslesings en opdragte voltooi het, kan u onmiddellik u geverifieerde digitale Sertifikaat van Voltooiing direk vanaf u Lucebra-profiel aflaai.
Verken meer in Tegnologie
Brei jou leerreis uit met geakkrediteerde sertifikate, e-boeke en interaktiewe regstreekse klasse.