
After going through this course, the students will understand:
if a survey is conducted to find out the causes of illness and death among women, then how to represent the survey figures in the form of a graph.
if the data on the number of girls per thousand boys in different sections of the society is given, then how to represent the information given by way of a bar graph.
If the data in respect of seats won by different political parties in polling outcome of state assembly elections is given, then how to draw the bar graph to represent the polling results.
Les Graphiques à Barres Dévoilés : Une Introduction Complète
Dévoiler la Puissance des Graphiques à Barres pour une Communication Efficace des Données
Lahat ng Antas • 6 Mga lektura • Panghabambuhay na Access
Na-verify na Master Instructor
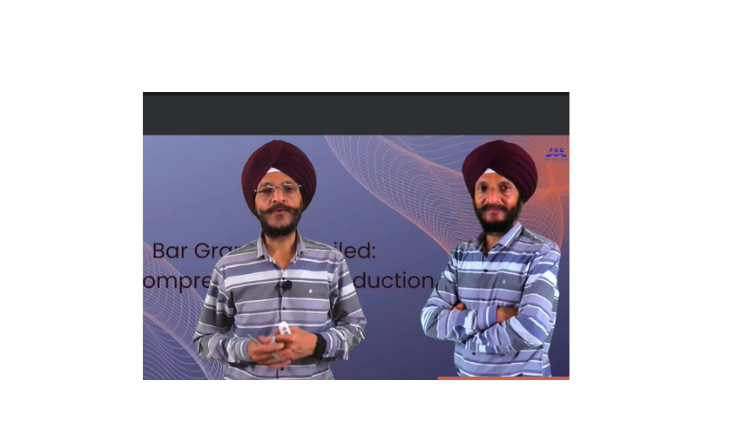
TRAILER
Kilalanin ang iyong instructor: Prabh Kirpa Classes
19 ms
5.0 / 5.0
Global Rating1
Mga Aktibong Mag-aaralIngles (American)
99 Mga Subtitle na Wika59 min
Kabuuang NilalamanAng matututuhan mo
Si une enquête est menée pour découvrir les causes de maladie et de décès chez les femmes, comment représenter les chiffres de l'enquête sous forme de graphique.
Si les données sur le nombre de filles pour mille garçons dans différentes sections de la société sont données, comment représenter les informations données par le biais d'un graphique à barres.
Si les données concernant les sièges remportés par différents partis politiques dans les résultats des élections de l'assemblée d'État sont données, comment dessiner le graphique à barres.
Les barres dans le graphique à barres sont-elles tracées verticalement ou horizontalement?
Nilalaman ng Kurso
2 na mga seksyon • 6 mga lektura • 00:59:22 kabuuang habaConclusion
01:18
- Why Bar graph or Bar Chart is used?
- Whether bars in the bar graph are drawn vertically or horizontally?
- Whether any space is left between bars?
- Whether each bar in the bar graph has an equal width?
- Whether bars in the bar graph are adjoining to each other?
- Whether bar graphs are simple or complex to understand?
Bar Graph: Polling results
09:09
If the data in respect of seats won by different political parties in polling outcome of state assembly elections is given, then how to draw the bar graph to represent the polling results.
Graph: Number of girls per thousand boys
15:47
If the data on the number of girls per thousand boys in different sections of the society is given, then how to represent the information given by way of a bar graph and what conclusions can be arrived at from the graph.
Bar Graph: Causes of illness and Death
14:32
If a survey is conducted to find out the causes of illness and death among women, then how to represent the survey figures in the form of a graph and to find out which condition is the major cause of women’s ill health and death worldwide.
Bar Graph: Causes of illness and Death
14:32
If a survey is conducted to find out the causes of illness and death among women, then how to represent the survey figures in the form of a graph and to find out which condition is the major cause of women’s ill health and death worldwide.
Lingguhang Plano ng Pag-aaral
Planuhin ang iyong paglalakbay sa pag-aaral
Ang AI ay lumilikha ng personalized na iskedyul ayon sa iyong oras5 oras/linggo
Mga kinakailangan
Connaissances de base en Algèbre et concepts Géométriques
Target na Audience
Students and any individual who enjoys learning about various mathematical concepts
Tungkol sa kursong ito
Après la collecte des données, les données doivent être présentées d'une manière facilement compréhensible. Pour présenter les données, nous pouvons utiliser différentes méthodes telles que les tableaux de distribution de fréquence, les graphiques à barres, etc.
Kilalanin ang iyong instruktor
Prabh Kirpa Classes
Pangunahing Instruktor
Educator
This channel is purely education based. Our aim is to ensure that the students are able to understand each and every question in an easy way. We take pride in providing quality educational services to the students of Class VII to Class XI Science NCERT, English, Computer solutions, Mathematics, Business Studies & Economics. Our goal is to help the leaders of tomorrow to learn to succeed today....
Iba pang mga Kurso ni
Prabh Kirpa ClassesBumili din ang mga estudyante
Ang mga mag-aaral na tumingin sa kursong ito ay nag-enroll din sa mga nangungunang kursong ito
Pagtuturo at Akademiko | Engineering
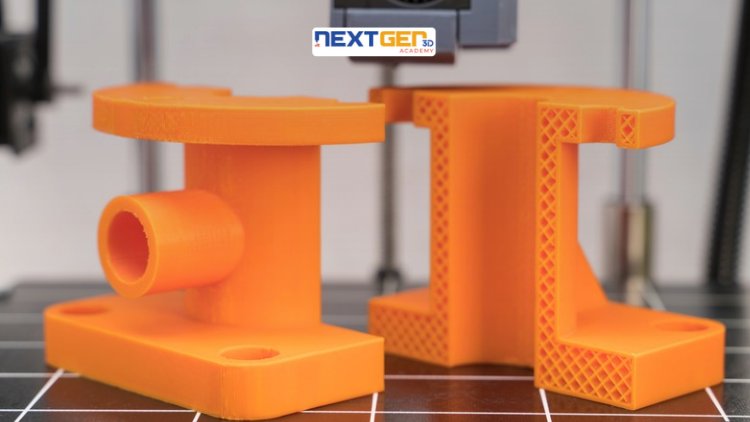
Unlock the world of 3D printing and product creation with a hands-on, industry-focused course designed to turn your ideas into reality. Whether you’re an engineer, designer, technician Masterclass.
5.0
3 oras
19 mga lecture
Intermediate
$12.99
Pagtuturo at Akademiko | Matematika
Taking Your Mastery of Probability to the Next Level
5.0
1 oras 30 min
6 mga lecture
Lahat
$9.99
$19.99
Pagtuturo at Akademiko | Matematika
Advanced Formulas and Strategies for Cone Surface Area Determination
5.0
1 oras
10 mga lecture
Lahat
$19.99
LIBRE

Pagtuturo at Akademiko | Kasalukuyang mga gawain
Master all important Current Affairs from June 1–30, 2026 with daily video lectures, MCQs, exam-oriented explanations an
5.0
8 oras 30 min
29 mga lecture
Baguhan
$29.99
$39.99
Pagtuturo at Akademiko | Matematika
Unlocking the Power of Bar Charts for Effective Data Communication
5.0
1 oras
5 mga lecture
Lahat
$14.99
$19.99
Frequently Bought Together
Learners who enrolled in this course also frequently purchased these complementary courses together.
7-Day Money Back Guarantee for all bundle items
Total price for selected items:
$42.38
$52.97
Mga Madalas Itanong
Maghanap ng mga sagot sa pinakakaraniwang tanong tungkol sa kursong ito.
Oo! Sa pagkumpleto ng 100% ng mga lektura at takdang-aralin sa kurso, maaari mong agad na i-download ang iyong na-verify na digital na Sertipiko ng Pagkumpleto nang direkta mula sa iyong profile sa Lucebra.
Mag-explore Pa sa Technology
Palawakin ang iyong pag-aaral gamit ang mga kinikilalang sertipiko, e-book, at live interactive na mga klase.