
- What is the meaning of statistics?
- What is meant by data?
- What is difference between Primary data and Secondary data?
- What are the various ways and means to collect data?
- How we can present data with the help of tables?
- What are the various applications of statistics?
สถิติเปิดเผย: จากการรวบรวบข้อมูลไปจนถึงการนำเสนอ
دليل شامل لفهم وتصور المعلومات
ทุกระดับ • 5 บรรยาย • เข้าถึงได้ตลอดชีวิต
อาจารย์ผู้สอนที่ได้รับการรับรอง
รถพ่วง
พบกับผู้สอนของคุณ: Prabh Kirpa Classes
19 ms
5.0 / 5.0
นักเรียนที่กระตือรือร้น1
นักเรียนที่กระตือรือร้นอังกฤษ - สหรัฐอเมริกา
คำบรรยาย 99 ภาษา37 นาที
เนื้อหาทั้งหมดสิ่งที่คุณจะได้เรียนรู้
ما هو معنى الإحصاء؟
ما هو الفرق بين البيانات الأولية والثانوية؟
ما هي الطرق المختلفة لجمع البيانات؟
كيف يمكننا عرض البيانات بمساعدة الجداول؟
เนื้อหาหลักสูตร
2 ส่วน • 5 การบรรยาย • 00:37:27 ความยาวรวมConclusion
02:24
Collection of Data
06:01
- Give five examples of data that you can collect from your day-to-day life?
- What is the meaning of primary data?
- Primary Data can be collected through various methods. What are those?
- What is meant by Secondary data?
- Secondary data can be sourced or collected from various sources. What are those?
- What is the difference between Primary Data and Secondary data.
Presentation of Data
19:56
- What is the next step after the collection of data?
- What is meant by presentation of data?
- In which scenario, the presentation of data in ascending or descending order can be quite time consuming?
- What is meant by ungrouped frequency distribution table? Elaborate it with the help of an example.
- What is the meaning of grouped frequency distribution table? Elaborate it with the help of an example.
- A class of 50 students has been divided into two groups on the basis of weight of students i.e. 30-50kg. (30 students) and 51-70kg (20 students). Suppose a new student of 50.5 kg. gets admission. Draw the grouped frequency distribution table for the new scenario.
Meaning of Statistics
07:23
- From where we everyday get a lot of information in the form of facts, numerical figures, tables or graphs etc.
- What is the meaning of data?
- What is the name of branch of mathematics where the extraction of meaningful information from data is studied?
- The word “statistics” has different meanings in different contexts. Elaborate.
แผนการเรียนรายสัปดาห์
วางแผนการเรียนรู้ของคุณ
AI สร้างตารางเวลาส่วนตัวตามเวลาว่างของคุณ5 ชั่วโมง/สัปดาห์
ความต้องการ
معرفة أساسية بالجبر والمفاهيم الهندسية
กลุ่มเป้าหมาย
Students and any individual who enjoys learning about various mathematical concept
เกี่ยวกับหลักสูตรนี้
يُستخدم الإحصاء في مجموعة متنوعة من المجالات. علِّق.
พบกับผู้สอนของคุณ
Prabh Kirpa Classes
อาจารย์ผู้สอนหลัก
Educator
This channel is purely education based. Our aim is to ensure that the students are able to understand each and every question in an easy way. We take pride in providing quality educational services to the students of Class VII to Class XI Science NCERT, English, Computer solutions, Mathematics, Business Studies & Economics. Our goal is to help the leaders of tomorrow to learn to succeed today....
คอร์สอื่น ๆ โดย
Prabh Kirpa Classesนักเรียนก็ซื้อด้วย
ผู้เรียนที่ดูหลักสูตรนี้ได้ลงทะเบียนเรียนในหลักสูตรที่ได้รับคะแนนสูงสุดเหล่านี้ด้วย
การสอนและวิชาการ | วิศวกรรม
Unlock the world of 3D printing and product creation with a hands-on, industry-focused course designed to turn your ideas into reality. Whether you’re an engineer, designer, technician Masterclass.
5.0
3 ชม.
19 การบรรยาย
ระดับกลาง
$12.99

การสอนและวิชาการ | คณิตศาสตร์
Taking Your Mastery of Probability to the Next Level
5.0
1 ชม. 30 นาที
6 การบรรยาย
ทุกระดับ
$9.99
$19.99
การสอนและวิชาการ | คณิตศาสตร์
Advanced Formulas and Strategies for Cone Surface Area Determination
5.0
1 ชม.
10 การบรรยาย
ทุกระดับ
$19.99
ฟรี

การสอนและวิชาการ | การจัดการลูกค้าสัมพันธ์ (CRM)
Master all important Current Affairs from June 1–30, 2026 with daily video lectures, MCQs, exam-oriented explanations an
5.0
8 ชม. 30 นาที
29 การบรรยาย
ระดับเริ่มต้น
$29.99
$39.99
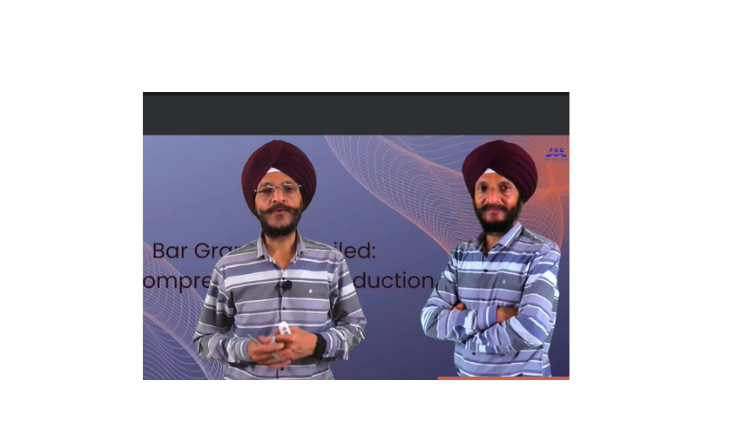
การสอนและวิชาการ | คณิตศาสตร์
Unlocking the Power of Bar Charts for Effective Data Communication
5.0
1 ชม.
5 การบรรยาย
ทุกระดับ
$14.99
$19.99
Frequently Bought Together
Learners who enrolled in this course also frequently purchased these complementary courses together.
7-Day Money Back Guarantee for all bundle items
Total price for selected items:
$42.38
$52.97
คำถามที่พบบ่อย
ค้นหาคำตอบของคำถามที่พบบ่อยเกี่ยวกับหลักสูตรนี้
ใช่! เมื่อเสร็จสิ้นการบรรยายและการมอบหมายหลักสูตร 100% คุณสามารถดาวน์โหลดใบรับรองการสำเร็จหลักสูตรดิจิทัลที่ผ่านการตรวจสอบแล้วได้ทันทีจากโปรไฟล์ Lucebra ของคุณ
สำรวจเพิ่มเติมใน Technology
ต่อยอดการเรียนรู้ของคุณด้วยใบรับรองที่ผ่านการรับรอง อีบุ๊กที่เกี่ยวข้อง และชั้นเรียนสดแบบอินเทอร์แอคทีฟ