
Lucebra
Lucebra Biznes

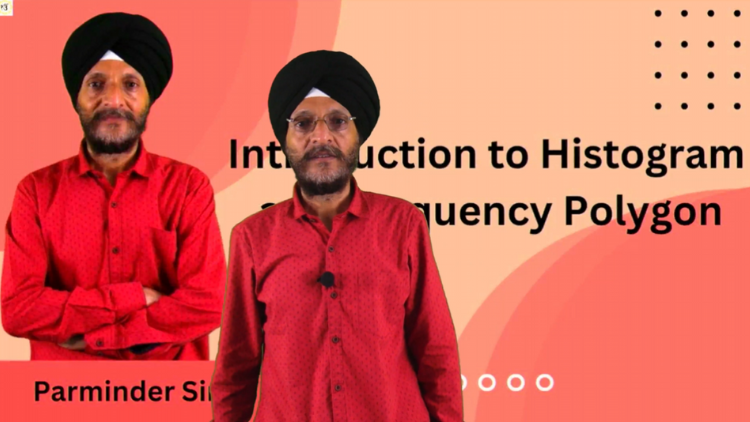
Histogramy i wieloboki częstości wyjaśnione

データの頻度の視覚的表現の理解と作成

Wszystkie poziomy • 5 Wykłady • Dożywotni dostęp
Prabh Kirpa Classes

Sprawdzony Mistrz Instruktor

ヒストグラムと頻度多角形の解明
PRZYCZEPA
Poznaj swojego instruktora: Prabh Kirpa Classes

19 ms

5.0 / 5.0
Globalna ocena
1
Aktywni studenci
Angielski amerykański
Napisy w 99 językach
1 godz. 8 min
Całkowita zawartość

Czego się dowiesz

1. 植物の葉の長さを測定し、データが不連続な階級区間の表で表現されている場合、ヒストグラムをどのように描くか
2. ヒストグラムを描くために使用したデータで、他の適切なグラフを描くことができるかどうか。
3. 一部のネオンランプの寿命に関するデータが表で与えられている場合、その情報をヒストグラムでどのように表現するか。
4. 表が2つのセクションの学生の成績による分布を示している場合、そのデータを使用して2つの頻度多角形をどのように作成するか。

Treść kursu

2 sekcji • 5 wykłady • 01:08:37 długość całkowita

Introduction

05:12
After going through this course, the students will understand:
  • if the length of some leaves of a plant is measured and the data is represented by a table having discontinuous class intervals, then how to draw a histogram for that data.
  • whether the data which is used to draw histogram, can be used to draw any other suitable graph.
  • if the data in respect of lifetimes of some neon lamps is given in the form of a table, how to represent the information with the help of a histogram.
  • if a table shows distribution of students in two sections according to the marks obtained by them, then how to use that data to form two frequency polygons on the same graph.
Histogram data: other option

15:13

Suppose we draw a histogram with the help of a table which is having data in the form of discontinuous class intervals. Whether there is any other suitable graphical representation for the same data.

Histogram : Life times of neon lamps

12:11

If the data in respect of lifetimes of some neon lamps is given in the form of a table, how to represent the information with the help of a histogram. How many lamps have a life time of more than specified hours?

Histogram: Length and number of leaves

20:00

If the length of some leaves of a plant is measured and the data is represented by a table having discontinuous class intervals, then how to draw a histogram for that data.

Frequency Polygon: Marks of students

15:58

If a table shows distribution of students in two sections according to the marks obtained by them, then how to use that data to form two frequency polygons on the same graph.
Tygodniowy Plan Nauki
Zaplanuj swoją naukę
AI tworzy spersonalizowany harmonogram na podstawie dostępności

Wymagania

代数の基本的な知識と幾何学の概念

Grupa docelowa

Students and any individual who enjoys learning about various mathematical concepts

O tym kursie

  • 植物の葉の長さを測定し、データが不連続な階級区間を持つ表で表現されている場合、そのデータのヒストグラムをどのように描くか。
  • 不連続な階級区間のデータを持つ表を使用してヒストグラムを描く場合、同じデータの他の適切なグラフィカル表現があるかどうか。
  • 一部のネオンランプの寿命に関するデータが表で与えられている場合、その情報をヒストグラムでどのように表現するか。指定された時間以上の寿命を持つランプはいくつあるか。
  • 表が2つのセクションの学生の成績による分布を示している場合、そのデータを使用して同じグラフ上に2つの頻度多角形をどのように作成するか。
  • 多量のデータを提示する必要がある場合、データをグループにまとめることができ、これらのグループは「クラス」または「階級区間」と呼ばれ、そのサイズはクラスサイズまたはクラス幅と呼ばれます。これらのグループ/クラスの各々において、最小の数値は下限クラス限界と呼ばれ、最大の数値は上限クラス限界と呼ばれます。ヒストグラムの場合、データは連続的な階級区間の形でなければなりません。頻度多角形の場合、データが連続的な階級区間である必要はありません。
  • Poznaj swojego instruktora
    Prabh Kirpa Classes
    5.0 Ocena
    63 Studenci
    Plan osobisty Lucebra
    Prabh Kirpa Classes
    Główny Instruktor
    Educator
    This channel is purely education based. Our aim is to ensure that the students are able to understand each and every question in an easy way. We take pride in providing quality educational services to the students of Class VII to Class XI Science NCERT, English, Computer solutions, Mathematics, Business Studies & Economics. Our goal is to help the leaders of tomorrow to learn to succeed today....
    Więcej kursów prowadzonych przez
    Prabh Kirpa Classes

    Studenci też kupili

    Uczniowie, którzy oglądali ten kurs, zapisali się również na te najwyżej oceniane kursy

    3D Printing Failure Analysis: Root Cause & Diagnostics Masterclass
    Nauczanie i edukacja | Inżynieria

    Unlock the world of 3D printing and product creation with a hands-on, industry-focused course designed to turn your ideas into reality. Whether you’re an engineer, designer, technician Masterclass.

    5.0
    3 godz.
    19 wykłady
    Mediator
    $12.99
    Probability Beyond the Basics: Part 1
    Nauczanie i edukacja | Matematyka

    Taking Your Mastery of Probability to the Next Level

    5.0
    1 godz. 30 min
    6 wykłady
    Wszystko
    $9.99

    $19.99

    Beyond Basics: Calculating Cone Surface Area with Precision
    Nauczanie i edukacja | Matematyka

    Advanced Formulas and Strategies for Cone Surface Area Determination

    5.0
    1 godz.
    10 wykłady
    Wszystko
    $19.99
    Future Tense
    BEZPŁATNY
    Nauczanie i edukacja | Gramatyka angielska

    FUTURE TENSE

    5.0
    2 godz.
    4 wykłady
    Wszystko
    BEZPŁATNY
    Zacznij teraz
    June 2026 Current Affairs Complete Revision Course
    Nauczanie i edukacja | Sprawy bieżące

    Master all important Current Affairs from June 1–30, 2026 with daily video lectures, MCQs, exam-oriented explanations an

    5.0
    8 godz. 30 min
    29 wykłady
    Początkujący
    $29.99

    $39.99

    Bar Graphs Unveiled: A Comprehensive Introduction
    Nauczanie i edukacja | Matematyka

    Unlocking the Power of Bar Charts for Effective Data Communication

    5.0
    1 godz.
    5 wykłady
    Wszystko
    $14.99

    $19.99

    Frequently Bought Together

    Learners who enrolled in this course also frequently purchased these complementary courses together.

    7-Day Money Back Guarantee for all bundle items

    Total price for selected items:

    $42.38

    $52.97

    🎉 Save 20% when bought together

    Często zadawane pytania

    Znajdź odpowiedzi na najczęściej zadawane pytania dotyczące tego kursu.

    Tak! Po ukończeniu 100% wykładów i zadań w ramach kursu możesz natychmiast pobrać zweryfikowany cyfrowy certyfikat ukończenia bezpośrednio ze swojego profilu Lucebra.

    Odkryj więcej w Technology

    Rozwiń swoją naukę dzięki akredytowanym certyfikatom, e-bookom i interaktywnym lekcjom na żywo.