
Lucebra
Lucebra Negosyo

हिस्ट्रोग्राम और फ़्रीक्वेंसी बहुभुजों को समझना

डेटा फ़्रीक्वेंसी के दृश्य प्रतिनिधित्व को समझना और बनाना

Lahat ng Antas • 5 Mga lektura • Panghabambuhay na Access
Prabh Kirpa Classes

Na-verify na Master Instructor

हिस्ट्रोग्राम और फ़्रीक्वेंसी बहुभुजों को समझना
TRAILER
Kilalanin ang iyong instructor: Prabh Kirpa Classes

19 ms

5.0 / 5.0
Global Rating
1
Mga Aktibong Mag-aaral
Ingles (American)
99 Mga Subtitle na Wika
1 oras 8 min
Kabuuang Nilalaman

Ang matututuhan mo

1. यदि किसी पौधे की कुछ पत्तियों की लंबाई को मापा जाता है और डेटा को असंतत वर्ग अंतरालों वाली तालिका द्वारा दर्शाया जाता है, तो हिस्ट्रोग्राम कैसे खींचना है
2. क्या हिस्ट्रोग्राम बनाने के लिए इस्तेमाल किया गया डेटा किसी अन्य उपयुक्त ग्राफ बनाने के लिए इस्तेमाल किया जा सकता है।
3. यदि किसी तालिका में कुछ नियॉन लैंप के जीवनकाल के बारे में डेटा दिया गया है, तो उस जानकारी को हिस्ट्रोग्राम की मदद से कैसे दर्शाया जाए।
4. यदि कोई तालिका दो वर्गों में छात्रों के वितरण को उनके द्वारा प्राप्त अंकों के अनुसार दिखाती है, तो उसी डेटा का उपयोग करके उसी ग्राफ पर दो फ़्रीक्वेंसी बहुभुज कैसे बनाएं।

Nilalaman ng Kurso

2 na mga seksyon • 5 mga lektura • 01:08:37 kabuuang haba

Introduction

05:12
After going through this course, the students will understand:
  • if the length of some leaves of a plant is measured and the data is represented by a table having discontinuous class intervals, then how to draw a histogram for that data.
  • whether the data which is used to draw histogram, can be used to draw any other suitable graph.
  • if the data in respect of lifetimes of some neon lamps is given in the form of a table, how to represent the information with the help of a histogram.
  • if a table shows distribution of students in two sections according to the marks obtained by them, then how to use that data to form two frequency polygons on the same graph.
Histogram data: other option

15:13

Suppose we draw a histogram with the help of a table which is having data in the form of discontinuous class intervals. Whether there is any other suitable graphical representation for the same data.

Histogram : Life times of neon lamps

12:11

If the data in respect of lifetimes of some neon lamps is given in the form of a table, how to represent the information with the help of a histogram. How many lamps have a life time of more than specified hours?

Histogram: Length and number of leaves

20:00

If the length of some leaves of a plant is measured and the data is represented by a table having discontinuous class intervals, then how to draw a histogram for that data.

Frequency Polygon: Marks of students

15:58

If a table shows distribution of students in two sections according to the marks obtained by them, then how to use that data to form two frequency polygons on the same graph.
Lingguhang Plano ng Pag-aaral
Planuhin ang iyong paglalakbay sa pag-aaral
Ang AI ay lumilikha ng personalized na iskedyul ayon sa iyong oras

Mga kinakailangan

बीजगणित और ज्यामितीय अवधारणाओं का मूलभूत ज्ञान

Target na Audience

Students and any individual who enjoys learning about various mathematical concepts

Tungkol sa kursong ito

  • यदि किसी पौधे की कुछ पत्तियों की लंबाई को मापा जाता है और डेटा को असंतत वर्ग अंतरालों वाली तालिका द्वारा दर्शाया जाता है, तो उस डेटा के लिए हिस्ट्रोग्राम कैसे खींचना है।
  • मान लीजिए कि असंतत वर्ग अंतरालों वाली तालिका की मदद से हिस्ट्रोग्राम खींचा जाता है। क्या उसी डेटा के लिए कोई अन्य उपयुक्त ग्राफिकल प्रतिनिधित्व है।
  • यदि किसी तालिका में कुछ नियॉन लैंप के जीवनकाल के बारे में डेटा दिया गया है, तो उस जानकारी को हिस्ट्रोग्राम की मदद से कैसे दर्शाया जाए। कितने लैंप निर्दिष्ट घंटों से अधिक समय तक चलते हैं?
  • यदि कोई तालिका दो वर्गों में छात्रों के वितरण को उनके द्वारा प्राप्त अंकों के अनुसार दिखाती है, तो उसी डेटा का उपयोग करके उसी ग्राफ पर दो फ़्रीक्वेंसी बहुभुज कैसे बनाएं।
  • जब बड़ी मात्रा में डेटा प्रस्तुत किया जाना है, तो डेटा को समूहों में संक्षिप्त किया जा सकता है और इन समूहों को “वर्ग” या “वर्ग-अंतराल” कहा जाता है और इनका आकार वर्ग-आकार या वर्ग चौड़ाई कहा जाता है। इन प्रत्येक समूहों/वर्गों में, न्यूनतम संख्या को निचला वर्ग सीमा और अधिक संख्या को ऊपरी वर्ग सीमा कहा जाता है। हिस्ट्रोग्राम के मामले में, डेटा को लगातार वर्ग अंतरालों के रूप में होना चाहिए। फ़्रीक्वेंसी बहुभुज के मामले में, डेटा को लगातार वर्ग अंतरालों में होना आवश्यक नहीं है।
  • Kilalanin ang iyong instruktor
    Prabh Kirpa Classes
    5.0 Rating
    63 Mag-aaral
    Tingnan ang Buong Profile
    Prabh Kirpa Classes
    Pangunahing Instruktor
    Educator
    This channel is purely education based. Our aim is to ensure that the students are able to understand each and every question in an easy way. We take pride in providing quality educational services to the students of Class VII to Class XI Science NCERT, English, Computer solutions, Mathematics, Business Studies & Economics. Our goal is to help the leaders of tomorrow to learn to succeed today....
    Iba pang mga Kurso ni
    Prabh Kirpa Classes

    Bumili din ang mga estudyante

    Ang mga mag-aaral na tumingin sa kursong ito ay nag-enroll din sa mga nangungunang kursong ito

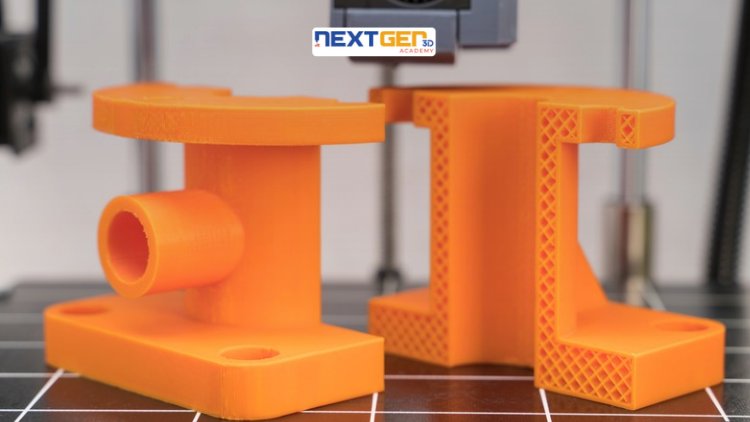
    3D Printing Failure Analysis: Root Cause & Diagnostics Masterclass
    Pagtuturo at Akademiko | Engineering

    Unlock the world of 3D printing and product creation with a hands-on, industry-focused course designed to turn your ideas into reality. Whether you’re an engineer, designer, technician Masterclass.

    5.0
    3 oras
    19 mga lecture
    Intermediate
    $12.99
    Probability Beyond the Basics: Part 1
    Pagtuturo at Akademiko | Matematika

    Taking Your Mastery of Probability to the Next Level

    5.0
    1 oras 30 min
    6 mga lecture
    Lahat
    $9.99

    $19.99

    Beyond Basics: Calculating Cone Surface Area with Precision
    Pagtuturo at Akademiko | Matematika

    Advanced Formulas and Strategies for Cone Surface Area Determination

    5.0
    1 oras
    10 mga lecture
    Lahat
    $19.99
    Future Tense
    LIBRE
    Pagtuturo at Akademiko | English Grammar

    FUTURE TENSE

    5.0
    2 oras
    4 mga lecture
    Lahat
    June 2026 Current Affairs Complete Revision Course
    Pagtuturo at Akademiko | Kasalukuyang mga gawain

    Master all important Current Affairs from June 1–30, 2026 with daily video lectures, MCQs, exam-oriented explanations an

    5.0
    8 oras 30 min
    29 mga lecture
    Baguhan
    $29.99

    $39.99

    Bar Graphs Unveiled: A Comprehensive Introduction
    Pagtuturo at Akademiko | Matematika

    Unlocking the Power of Bar Charts for Effective Data Communication

    5.0
    1 oras
    5 mga lecture
    Lahat
    $14.99

    $19.99

    Frequently Bought Together

    Learners who enrolled in this course also frequently purchased these complementary courses together.

    7-Day Money Back Guarantee for all bundle items

    Total price for selected items:

    $42.38

    $52.97

    🎉 Save 20% when bought together

    Mga Madalas Itanong

    Maghanap ng mga sagot sa pinakakaraniwang tanong tungkol sa kursong ito.

    Oo! Sa pagkumpleto ng 100% ng mga lektura at takdang-aralin sa kurso, maaari mong agad na i-download ang iyong na-verify na digital na Sertipiko ng Pagkumpleto nang direkta mula sa iyong profile sa Lucebra.

    Mag-explore Pa sa Technology

    Palawakin ang iyong pag-aaral gamit ang mga kinikilalang sertipiko, e-book, at live interactive na mga klase.