
Lucebra
Lucebra Perniagaan

Histograms and Frequency Polygons Demystified

Understanding and Creating Visual Representations of Data Frequency

Semua Tahap • 5 Kuliah • Akses Sepanjang Hayat
Prabh Kirpa Classes

Pengajar Sarjana Disahkan

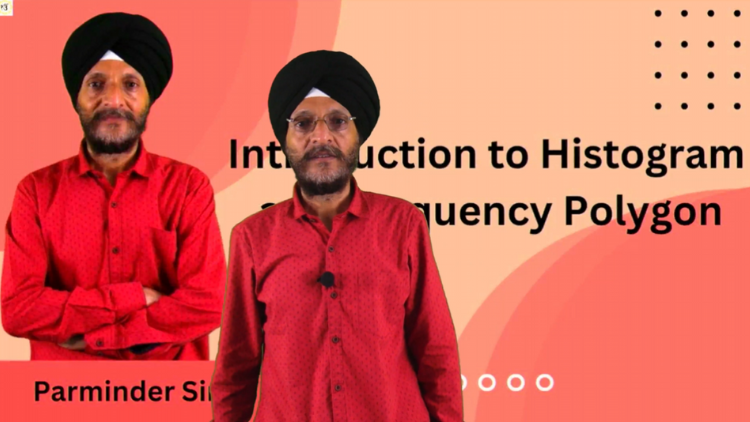
Histograms and Frequency Polygons Demystified
TRAILER
Temui pengajar anda: Prabh Kirpa Classes

19 ms

5.0 / 5.0
Sarikata 99 Bahasa
1
Pelajar Aktif
Inggeris AS
Sarikata 99 Bahasa
1 jam 8 min
Jumlah Kandungan

Apa yang anda akan pelajari

1. if the length of some leaves of a plant is measured and the data is represented by a table having discontinuous class intervals, then how to draw a histogram
2. Whether the data which is used to draw histogram, can be used to draw any other suitable graph.
3. If the data in respect of lifetimes of some neon lamps is given in the form of a table, how to represent the information with the help of a histogram.
4. If a table shows distribution of students in two sections according to the marks obtained by them, then how to use that data to form two frequency polygons o

Kandungan Kursus

2 bahagian • 5 kuliah • 01:08:37 jumlah panjang

Introduction

05:12
After going through this course, the students will understand:
  • if the length of some leaves of a plant is measured and the data is represented by a table having discontinuous class intervals, then how to draw a histogram for that data.
  • whether the data which is used to draw histogram, can be used to draw any other suitable graph.
  • if the data in respect of lifetimes of some neon lamps is given in the form of a table, how to represent the information with the help of a histogram.
  • if a table shows distribution of students in two sections according to the marks obtained by them, then how to use that data to form two frequency polygons on the same graph.
Histogram data: other option

15:13

Suppose we draw a histogram with the help of a table which is having data in the form of discontinuous class intervals. Whether there is any other suitable graphical representation for the same data.

Histogram : Life times of neon lamps

12:11

If the data in respect of lifetimes of some neon lamps is given in the form of a table, how to represent the information with the help of a histogram. How many lamps have a life time of more than specified hours?

Histogram: Length and number of leaves

20:00

If the length of some leaves of a plant is measured and the data is represented by a table having discontinuous class intervals, then how to draw a histogram for that data.

Frequency Polygon: Marks of students

15:58

If a table shows distribution of students in two sections according to the marks obtained by them, then how to use that data to form two frequency polygons on the same graph.
Pelan Belajar Mingguan
Rancang perjalanan pembelajaran anda
AI menjana jadual peribadi berdasarkan ketersediaan anda

Keperluan

Basic knowledge of Algebra and Geometric concepts

Khalayak Sasaran

Students and any individual who enjoys learning about various mathematical concepts

Mengenai kursus ini

  • If the length of some leaves of a plant is measured and the data is represented by a table having discontinuous class intervals, then how to draw a histogram for that data.
  • Suppose we draw a histogram with the help of a table which is having data in the form of discontinuous class intervals. Whether there is any other suitable graphical representation for the same data.
  • If the data in respect of lifetimes of some neon lamps is given in the form of a table, how to represent the information with the help of a histogram. How many lamps have a life time of more than specified hours?
  • If a table shows distribution of students in two sections according to the marks obtained by them, then how to use that data to form two frequency polygons on the same graph.
  • When the large amount of data is to be presented, we can condense the data in to groups and these groupings are called “classes” or “class-intervals” and their size is called the class-size or class width. In each of these groupings/classes, the least number is called the lower class limit and the greater number is called the upper class limit. In the case of histogram, the data has to be in the form of continuous class intervals. In the case of frequency polygon, it is not necessary for the data to be in continuous class intervals.
  • Kenali Pengajar Anda
    Prabh Kirpa Classes
    Lihat Profil Penuh
    63 Pelajar
    Pengajar Utama
    Prabh Kirpa Classes
    Pengajar Utama
    Educator
    This channel is purely education based. Our aim is to ensure that the students are able to understand each and every question in an easy way. We take pride in providing quality educational services to the students of Class VII to Class XI Science NCERT, English, Computer solutions, Mathematics, Business Studies & Economics. Our goal is to help the leaders of tomorrow to learn to succeed today....
    Lebih Banyak Kursus oleh
    Prabh Kirpa Classes

    Pelajar pun beli

    Pelajar yang melihat kursus ini turut mendaftar dalam kursus yang mendapat penilaian tertinggi ini

    3D Printing Failure Analysis: Root Cause & Diagnostics Masterclass
    Pengajaran & Akademik | Kejuruteraan

    Unlock the world of 3D printing and product creation with a hands-on, industry-focused course designed to turn your ideas into reality. Whether you’re an engineer, designer, technician Masterclass.

    5.0
    3 jam
    19 Semua
    Pertengahan
    $12.99
    Probability Beyond the Basics: Part 1
    Pengajaran & Akademik | Matematik

    Taking Your Mastery of Probability to the Next Level

    5.0
    1 jam 30 min
    6 Semua
    Semua Peringkat
    $9.99

    $19.99

    Beyond Basics: Calculating Cone Surface Area with Precision
    Pengajaran & Akademik | Matematik

    Advanced Formulas and Strategies for Cone Surface Area Determination

    5.0
    1 jam
    10 Semua
    Semua Peringkat
    $19.99
    Future Tense
    Prajualan
    Pengajaran & Akademik | Tatabahasa Inggeris

    FUTURE TENSE

    5.0
    2 jam
    4 Semua
    Semua Peringkat
    June 2026 Current Affairs Complete Revision Course
    Pengajaran & Akademik | Hal Ehwal Semasa

    Master all important Current Affairs from June 1–30, 2026 with daily video lectures, MCQs, exam-oriented explanations an

    5.0
    8 jam 30 min
    29 Semua
    pemula
    $29.99

    $39.99

    Bar Graphs Unveiled: A Comprehensive Introduction
    Pengajaran & Akademik | Matematik

    Unlocking the Power of Bar Charts for Effective Data Communication

    5.0
    1 jam
    5 Semua
    Semua Peringkat
    $14.99

    $19.99

    Frequently Bought Together

    Learners who enrolled in this course also frequently purchased these complementary courses together.

    7-Day Money Back Guarantee for all bundle items

    Total price for selected items:

    $42.38

    $52.97

    🎉 Save 20% when bought together

    Soalan Lazim

    Cari jawapan kepada soalan yang paling biasa tentang kursus ini.

    Ya! Setelah menyelesaikan 100% kuliah dan tugasan kursus, anda boleh memuat turun serta-merta Sijil Tamat Digital yang disahkan terus daripada profil Lucebra anda.

    Terokai Lebih Lanjut dalam Technology

    Kembangkan perjalanan pembelajaran anda dengan sijil yang diiktiraf, e-buku berkaitan dan kelas interaktif langsung.