
Lucebra
Lucebra Negocios

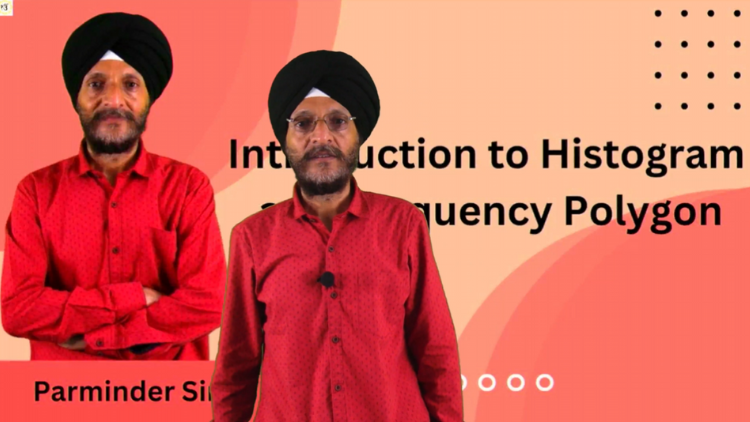
Histogramas y Polígonos de Frecuencia Desmitificados

Comprendiendo y Creando Representaciones Visuales de la Frecuencia de Datos

Todos los niveles • 5 Lecciones • Acceso de por vida
Prabh Kirpa Classes

Instructor Maestro Verificado

Histogramas y Polígonos de Frecuencia Desmitificados
TRÁILER
Conoce a tu instructor: Prabh Kirpa Classes

19 ms

5.0 / 5.0
Calificación Global
1
Estudiantes Activos
Inglés estadounidense
Subtítulos en 99 idiomas
1h 8m
Contenido Total

Lo que aprenderás

1. Si la longitud de algunas hojas de una planta se mide y los datos se representan mediante una tabla con intervalos de clase discontinuos, ¿cómo dibujar un histograma
2. ¿Los datos que se utilizan para dibujar un histograma, pueden usarse para dibujar algún otro gráfico adecuado?
3. Si los datos con respecto a las vidas útiles de algunas lámparas de neón se dan en forma de tabla, ¿cómo representar la información con la ayuda de un histograma.
4. Si una tabla muestra la distribución de estudiantes en dos secciones según las calificaciones obtenidas por ellos, ¿cómo usar esos datos para formar dos polígonos de frecuencia?

Contenido del curso

2 secciones • 5 lecciones • 01:08:37 duración total

Introduction

05:12
After going through this course, the students will understand:
  • if the length of some leaves of a plant is measured and the data is represented by a table having discontinuous class intervals, then how to draw a histogram for that data.
  • whether the data which is used to draw histogram, can be used to draw any other suitable graph.
  • if the data in respect of lifetimes of some neon lamps is given in the form of a table, how to represent the information with the help of a histogram.
  • if a table shows distribution of students in two sections according to the marks obtained by them, then how to use that data to form two frequency polygons on the same graph.
Histogram data: other option

15:13

Suppose we draw a histogram with the help of a table which is having data in the form of discontinuous class intervals. Whether there is any other suitable graphical representation for the same data.

Histogram : Life times of neon lamps

12:11

If the data in respect of lifetimes of some neon lamps is given in the form of a table, how to represent the information with the help of a histogram. How many lamps have a life time of more than specified hours?

Histogram: Length and number of leaves

20:00

If the length of some leaves of a plant is measured and the data is represented by a table having discontinuous class intervals, then how to draw a histogram for that data.

Frequency Polygon: Marks of students

15:58

If a table shows distribution of students in two sections according to the marks obtained by them, then how to use that data to form two frequency polygons on the same graph.
Plan de Estudio Semanal
Planifica tu aprendizaje
La IA genera un horario personalizado según tu disponibilidad

Requisitos

Conocimientos básicos de Álgebra y conceptos geométricos

A quién va dirigido

Students and any individual who enjoys learning about various mathematical concepts

Acerca de este curso

  • Si se mide la longitud de algunas hojas de una planta y los datos se representan mediante una tabla con intervalos de clase discontinuos, ¿cómo dibujar un histograma para esos datos?
  • Supongamos que dibujamos un histograma con la ayuda de una tabla que tiene datos en forma de intervalos de clase discontinuos. ¿Existe alguna otra representación gráfica adecuada para los mismos datos?
  • Si los datos con respecto a las vidas útiles de algunas lámparas de neón se dan en forma de tabla, ¿cómo representar la información con la ayuda de un histograma? ¿Cuántas lámparas tienen una vida útil de más horas especificadas?
  • Si una tabla muestra la distribución de estudiantes en dos secciones según las calificaciones obtenidas por ellos, ¿cómo usar esos datos para formar dos polígonos de frecuencia en el mismo gráfico?
  • Cuando se debe presentar una gran cantidad de datos, podemos condensar los datos en grupos y estos agrupamientos se llaman "clases" o "intervalos de clase" y su tamaño se llama clase-tamaño o ancho de clase. En cada uno de estos agrupamientos/clases, el número menor se llama límite inferior de clase y el número mayor se llama límite superior de clase. En el caso del histograma, los datos deben estar en forma de intervalos de clase continuos. En el caso del polígono de frecuencia, no es necesario que los datos estén en intervalos de clase continuos.
  • Conoce a tu instructor
    Prabh Kirpa Classes
    5.0 Calificación
    63 Estudiantes
    Ver perfil completo
    Prabh Kirpa Classes
    Instructor Principal
    Educator
    This channel is purely education based. Our aim is to ensure that the students are able to understand each and every question in an easy way. We take pride in providing quality educational services to the students of Class VII to Class XI Science NCERT, English, Computer solutions, Mathematics, Business Studies & Economics. Our goal is to help the leaders of tomorrow to learn to succeed today....
    Más cursos de
    Prabh Kirpa Classes

    Los estudiantes también compraron

    Los estudiantes que vieron este curso también se inscribieron en estos cursos mejor calificados

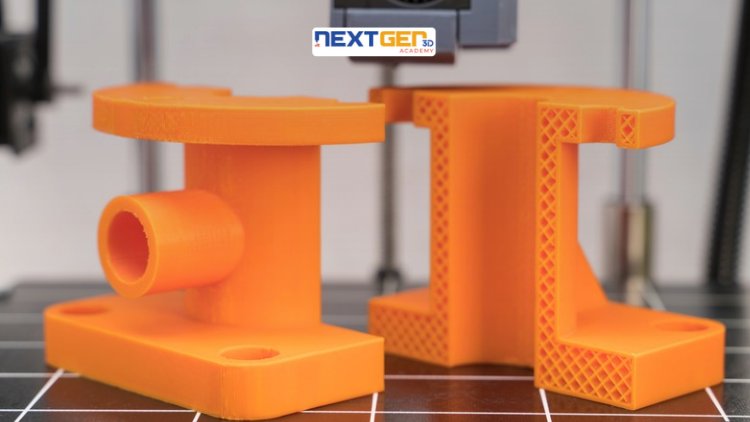
    3D Printing Failure Analysis: Root Cause & Diagnostics Masterclass
    Enseñanza y Academia | Ingeniería

    Unlock the world of 3D printing and product creation with a hands-on, industry-focused course designed to turn your ideas into reality. Whether you’re an engineer, designer, technician Masterclass.

    5.0
    3h
    19 clases
    Intermedio
    $12.99
    Probability Beyond the Basics: Part 1
    Enseñanza y Academia | Matemáticas

    Taking Your Mastery of Probability to the Next Level

    5.0
    1h 30m
    6 clases
    Todos
    $9.99

    $19.99

    Beyond Basics: Calculating Cone Surface Area with Precision
    Enseñanza y Academia | Matemáticas

    Advanced Formulas and Strategies for Cone Surface Area Determination

    5.0
    1h
    10 clases
    Todos
    $19.99
    Future Tense
    GRATIS
    Enseñanza y Academia | gramática inglesa

    FUTURE TENSE

    5.0
    2h
    4 clases
    Todos
    June 2026 Current Affairs Complete Revision Course
    Enseñanza y Academia | Asuntos actuales

    Master all important Current Affairs from June 1–30, 2026 with daily video lectures, MCQs, exam-oriented explanations an

    5.0
    8h 30m
    29 clases
    Principiante
    $29.99

    $39.99

    Bar Graphs Unveiled: A Comprehensive Introduction
    Enseñanza y Academia | Matemáticas

    Unlocking the Power of Bar Charts for Effective Data Communication

    5.0
    1h
    5 clases
    Todos
    $14.99

    $19.99

    Frequently Bought Together

    Learners who enrolled in this course also frequently purchased these complementary courses together.

    7-Day Money Back Guarantee for all bundle items

    Total price for selected items:

    $42.38

    $52.97

    🎉 Save 20% when bought together

    Preguntas frecuentes

    Encuentre respuestas a las preguntas más comunes sobre este curso.

    ¡Sí! Al completar el 100% de las conferencias y tareas del curso, podrá descargar instantáneamente su Certificado de finalización digital verificado directamente desde su perfil de Lucebra.

    Explorar más en Technology

    Amplía tu aprendizaje con certificados acreditados, libros digitales relacionados y clases interactivas en vivo.