
After going through this course, the students will understand:
if a survey is conducted to find out the causes of illness and death among women, then how to represent the survey figures in the form of a graph.
if the data on the number of girls per thousand boys in different sections of the society is given, then how to represent the information given by way of a bar graph.
If the data in respect of seats won by different political parties in polling outcome of state assembly elections is given, then how to draw the bar graph to represent the polling results.
Grafik Batang Terbongkar: Pengantar Komprehensif
Membuka Kekuatan Grafik Batang untuk Komunikasi Data yang Efektif
Барлық деңгейлер • 6 Дәрістер • Өмір бойы қол жеткізу
Тексерілген шебер нұсқаушы
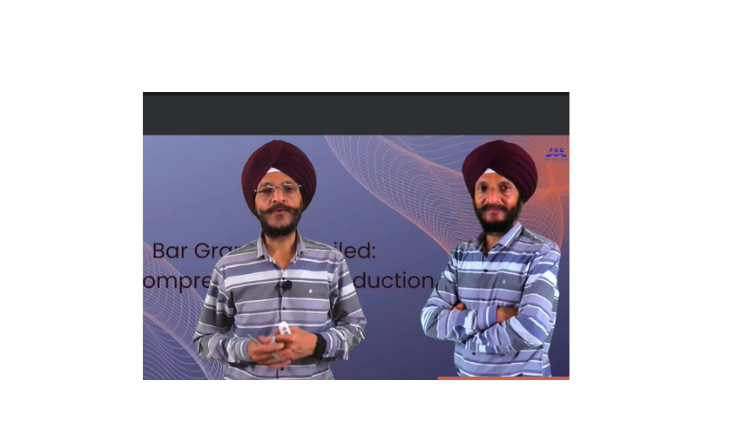
ТРЕЙЛЕР
Нұсқаушымен танысыңыз: Prabh Kirpa Classes
19 ms
5.0 / 5.0
Жаһандық рейтинг1
Белсенді студенттерАғылшын тілі (Америка Құрама Штаттары)
99 Тілдер субтитрлері59 мин
Жалпы мазмұнСіз не үйренесіз
Jika survei dilakukan untuk mengetahui penyebab penyakit dan kematian pada wanita, maka bagaimana cara menyajikan angka survei dalam bentuk grafik.
Jika data mengenai jumlah gadis per seribu anak laki-laki di berbagai bagian masyarakat diberikan, maka bagaimana cara menyajikan informasi yang diberikan dengan cara grafik batang.
Jika data mengenai kursi yang dimenangkan oleh partai politik yang berbeda dalam hasil pemilihan umum pemilihan dewan negara bagian diberikan, maka bagaimana cara menggambar grafik batang.
Apakah batang dalam grafik batang ditarik secara vertikal atau horizontal?
Курстың мазмұны
2 бөлімдер • 6 дәрістер • 00:59:22 жалпы ұзындығыConclusion
01:18
- Why Bar graph or Bar Chart is used?
- Whether bars in the bar graph are drawn vertically or horizontally?
- Whether any space is left between bars?
- Whether each bar in the bar graph has an equal width?
- Whether bars in the bar graph are adjoining to each other?
- Whether bar graphs are simple or complex to understand?
Bar Graph: Polling results
09:09
If the data in respect of seats won by different political parties in polling outcome of state assembly elections is given, then how to draw the bar graph to represent the polling results.
Graph: Number of girls per thousand boys
15:47
If the data on the number of girls per thousand boys in different sections of the society is given, then how to represent the information given by way of a bar graph and what conclusions can be arrived at from the graph.
Bar Graph: Causes of illness and Death
14:32
If a survey is conducted to find out the causes of illness and death among women, then how to represent the survey figures in the form of a graph and to find out which condition is the major cause of women’s ill health and death worldwide.
Bar Graph: Causes of illness and Death
14:32
If a survey is conducted to find out the causes of illness and death among women, then how to represent the survey figures in the form of a graph and to find out which condition is the major cause of women’s ill health and death worldwide.
Апталық оқу жоспары
Оқу жолыңызды жоспарлаңыз
AI сіздің уақытыңызға сай жеке кесте құрады5 сағ/апта
Талаптар
Pengetahuan dasar tentang Aljabar dan konsep Geometri
Мақсатты аудитория
Students and any individual who enjoys learning about various mathematical concepts
Бұл курс туралы
Setelah pengumpulan data, data harus disajikan sedemikian rupa sehingga mudah dipahami. Untuk menyajikan data, kita dapat menggunakan berbagai metode seperti tabel distribusi frekuensi, grafik batang, dll.
Оқытушыңызбен танысыңыз
Prabh Kirpa Classes
Бас нұсқаушы
Educator
This channel is purely education based. Our aim is to ensure that the students are able to understand each and every question in an easy way. We take pride in providing quality educational services to the students of Class VII to Class XI Science NCERT, English, Computer solutions, Mathematics, Business Studies & Economics. Our goal is to help the leaders of tomorrow to learn to succeed today....
Оқытушының басқа курстары:
Prabh Kirpa ClassesСтуденттер де сатып алды
Бұл курсты көрген оқушылар да осы жоғары бағаланған курстарға жазылды
Оқыту және академиялық білім | Инженерлік
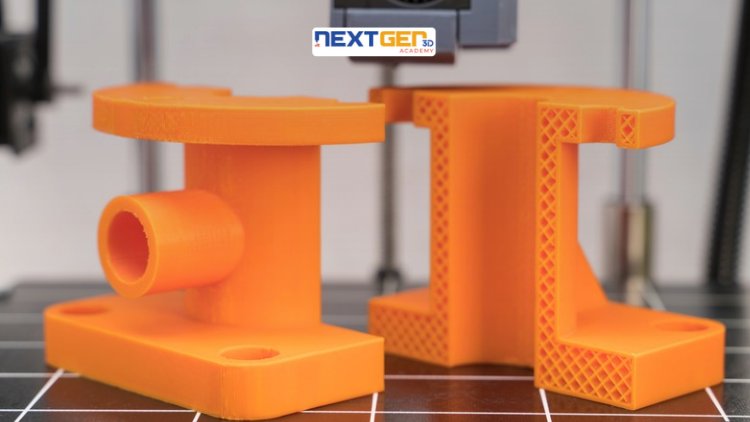
Unlock the world of 3D printing and product creation with a hands-on, industry-focused course designed to turn your ideas into reality. Whether you’re an engineer, designer, technician Masterclass.
5.0
3 сағ
19 Дәрістер
Орташа
$12.99

Оқыту және академиялық білім | Математика
Taking Your Mastery of Probability to the Next Level
5.0
1 сағ 30 мин
6 Дәрістер
Барлығы
$9.99
$19.99
Оқыту және академиялық білім | Математика
Advanced Formulas and Strategies for Cone Surface Area Determination
5.0
1 сағ
10 Дәрістер
Барлығы
$19.99
Тегін
Оқыту және академиялық білім | Ағылшын тілі грамматикасыҚазір жазылу
FUTURE TENSE
5.0
2 сағ
4 Дәрістер
Барлығы
Тегін

Оқыту және академиялық білім | Ағымдағы істер
Master all important Current Affairs from June 1–30, 2026 with daily video lectures, MCQs, exam-oriented explanations an
5.0
8 сағ 30 мин
29 Дәрістер
Бастаушы
$29.99
$39.99
Оқыту және академиялық білім | Математика
Unlocking the Power of Bar Charts for Effective Data Communication
5.0
1 сағ
5 Дәрістер
Барлығы
$14.99
$19.99
Frequently Bought Together
Learners who enrolled in this course also frequently purchased these complementary courses together.
7-Day Money Back Guarantee for all bundle items
Total price for selected items:
$42.38
$52.97
Жиі қойылатын сұрақтар
Осы курсқа қатысты жиі қойылатын сұрақтарға жауап табыңыз.
Иә! Курстың лекциялары мен тапсырмаларының 100% орындағаннан кейін сіз өзіңіздің расталған цифрлық аяқтау сертификатыңызды тікелей Lucebra профиліңізден жүктеп ала аласыз.
Technology бойынша көбірек біліңіз
Аккредиттелген сертификаттар, электронды кітаптар және тікелей эфирдегі сабақтармен біліміңізді кеңейтіңіз.