
After going through this course, the students will understand:
if a survey is conducted to find out the causes of illness and death among women, then how to represent the survey figures in the form of a graph.
if the data on the number of girls per thousand boys in different sections of the society is given, then how to represent the information given by way of a bar graph.
If the data in respect of seats won by different political parties in polling outcome of state assembly elections is given, then how to draw the bar graph to represent the polling results.
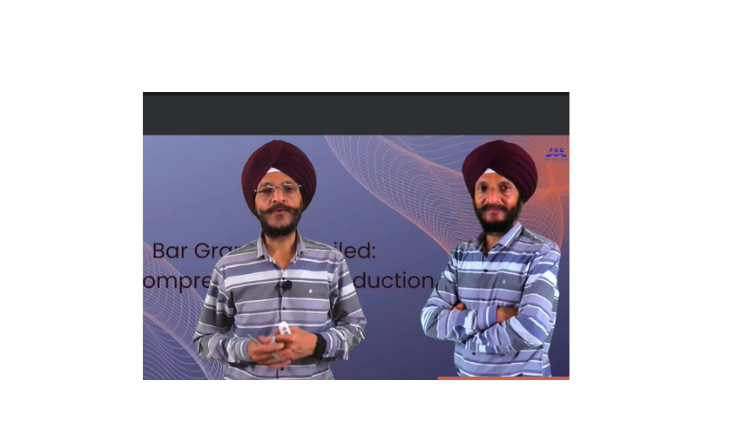
拖車
認識您的導師:Prabh Kirpa Classes
19 ms
5.0 / 5.0
全球評級1
活躍的學生美国英语
99 種語言字幕59分
總內容你將學到什麼
女性の病気と死亡原因を調査するアンケートが実施された場合、調査数字をグラフの形で表現する方法。
社会の異なるセクションにおける1000人の男子に対する女子の数字のデータが与えられた場合、与えられた情報を棒グラフで表現する方法。
州議会選挙の投票結果における異なる政党が獲得した議席のデータが与えられた場合、棒グラフを描く方法。
棒グラフの棒は垂直に描かれるのか、水平に描かれるのか?
課程內容
2 部分 • 6 講座 • 00:59:22 總長度Conclusion
01:18
- Why Bar graph or Bar Chart is used?
- Whether bars in the bar graph are drawn vertically or horizontally?
- Whether any space is left between bars?
- Whether each bar in the bar graph has an equal width?
- Whether bars in the bar graph are adjoining to each other?
- Whether bar graphs are simple or complex to understand?
Bar Graph: Polling results
09:09
If the data in respect of seats won by different political parties in polling outcome of state assembly elections is given, then how to draw the bar graph to represent the polling results.
Graph: Number of girls per thousand boys
15:47
If the data on the number of girls per thousand boys in different sections of the society is given, then how to represent the information given by way of a bar graph and what conclusions can be arrived at from the graph.
Bar Graph: Causes of illness and Death
14:32
If a survey is conducted to find out the causes of illness and death among women, then how to represent the survey figures in the form of a graph and to find out which condition is the major cause of women’s ill health and death worldwide.
Bar Graph: Causes of illness and Death
14:32
If a survey is conducted to find out the causes of illness and death among women, then how to represent the survey figures in the form of a graph and to find out which condition is the major cause of women’s ill health and death worldwide.
每週學習計劃
規劃您的學習之旅
AI根據您的可用時間生成個人化時間表5 小時/週
要求
代数と幾何学の基本的な知識
目標受眾
Students and any individual who enjoys learning about various mathematical concepts
關於本課程
データ収集後、データは容易に理解できるような方法で提示される必要があります。データを提示するために、頻度分布表、棒グラフなどの異なる方法を用いる事ができます。
認識您的講師
Prabh Kirpa Classes
主要導師
Educator
This channel is purely education based. Our aim is to ensure that the students are able to understand each and every question in an easy way. We take pride in providing quality educational services to the students of Class VII to Class XI Science NCERT, English, Computer solutions, Mathematics, Business Studies & Economics. Our goal is to help the leaders of tomorrow to learn to succeed today....
該講師的其他課程:
Prabh Kirpa Classes學生也買了
查看此課程的學習者也註冊了這些評價最高的課程
教學與學術 | 工程
Unlock the world of 3D printing and product creation with a hands-on, industry-focused course designed to turn your ideas into reality. Whether you’re an engineer, designer, technician Masterclass.
5.0
3小時
19 講座
中間的
$12.99

教學與學術 | 數學
Taking Your Mastery of Probability to the Next Level
5.0
1小時 30分
6 講座
全部
$9.99
$19.99

教學與學術 | 數學
Advanced Formulas and Strategies for Cone Surface Area Determination
5.0
1小時
10 講座
全部
$19.99

免費

教學與學術 | 時事
Master all important Current Affairs from June 1–30, 2026 with daily video lectures, MCQs, exam-oriented explanations an
5.0
8小時 30分
29 講座
初學者
$29.99
$39.99
教學與學術 | 數學
Unlocking the Power of Bar Charts for Effective Data Communication
5.0
1小時
5 講座
全部
$14.99
$19.99
Frequently Bought Together
Learners who enrolled in this course also frequently purchased these complementary courses together.
7-Day Money Back Guarantee for all bundle items
Total price for selected items:
$42.38
$52.97
常見問題解答
尋找有關本課程的最常見問題的答案。
是的! 100% 完成課程講座和作業後,您可以立即直接從您的 Lucebra 個人資料下載經過驗證的數位結業證書。
探索更多 Technology 內容
透過權威認證證書、精選電子書與即時互動直播課程拓展您的學習之旅。