
- What is the meaning of statistics?
- What is meant by data?
- What is difference between Primary data and Secondary data?
- What are the various ways and means to collect data?
- How we can present data with the help of tables?
- What are the various applications of statistics?
Statistik avslöjad: Från datainsamling till presentation
راهنمای جامع برای درک و تجسم اطلاعات
Alla nivåer • 5 Föreläsningar • Livstidsåtkomst
Verifierad masterinstruktör
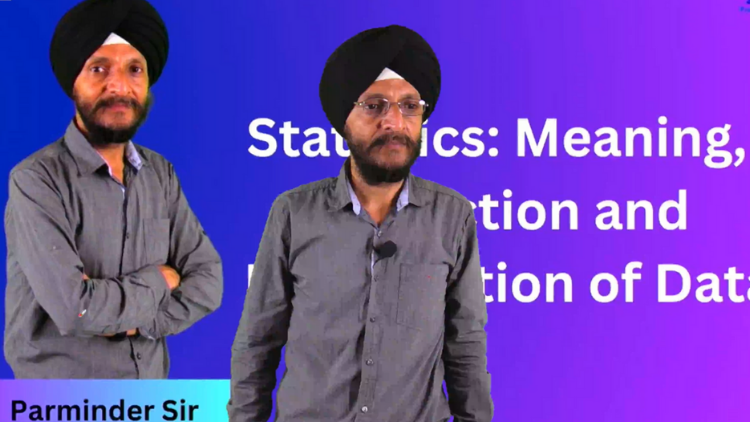
TRAILER
Möt din instruktör: Prabh Kirpa Classes
19 ms
5.0 / 5.0
Globalt betyg1
Aktiva studenterAmerikansk engelska
99 Språk Undertexter37 min
Totalt innehållVad du kommer att lära dig
معنی آمار چیست؟
تفاوت داده اولیه و داده ثانویه چیست؟
راههای مختلف و وسایل جمعآوری دادهها چیست؟
چگونه میتوانیم دادهها را با کمک جداول ارائه دهیم؟
Kursinnehåll
2 avsnitt • 5 föreläsningar • 00:37:27 total längdConclusion
02:24
Collection of Data
06:01
- Give five examples of data that you can collect from your day-to-day life?
- What is the meaning of primary data?
- Primary Data can be collected through various methods. What are those?
- What is meant by Secondary data?
- Secondary data can be sourced or collected from various sources. What are those?
- What is the difference between Primary Data and Secondary data.
Presentation of Data
19:56
- What is the next step after the collection of data?
- What is meant by presentation of data?
- In which scenario, the presentation of data in ascending or descending order can be quite time consuming?
- What is meant by ungrouped frequency distribution table? Elaborate it with the help of an example.
- What is the meaning of grouped frequency distribution table? Elaborate it with the help of an example.
- A class of 50 students has been divided into two groups on the basis of weight of students i.e. 30-50kg. (30 students) and 51-70kg (20 students). Suppose a new student of 50.5 kg. gets admission. Draw the grouped frequency distribution table for the new scenario.
Meaning of Statistics
07:23
- From where we everyday get a lot of information in the form of facts, numerical figures, tables or graphs etc.
- What is the meaning of data?
- What is the name of branch of mathematics where the extraction of meaningful information from data is studied?
- The word “statistics” has different meanings in different contexts. Elaborate.
Veckovis Studieplan
Planera din lärresa
AI skapar ett personligt schema baserat på din tillgänglighet5 tim/vecka
Krav
شناخت پایهای از جبر و مفاهیم هندسی
Målgrupp
Students and any individual who enjoys learning about various mathematical concept
Om denna kurs
آمار در زمینههای مختلفی مورد استفاده قرار میگیرد. نظرتان چیست؟
Träffa din instruktör
Prabh Kirpa Classes
Huvudinstruktör
Educator
This channel is purely education based. Our aim is to ensure that the students are able to understand each and every question in an easy way. We take pride in providing quality educational services to the students of Class VII to Class XI Science NCERT, English, Computer solutions, Mathematics, Business Studies & Economics. Our goal is to help the leaders of tomorrow to learn to succeed today....
Fler kurser av
Prabh Kirpa ClassesStudenter köpte också
Elever som tittade på den här kursen anmälde sig också till dessa högst rankade kurser
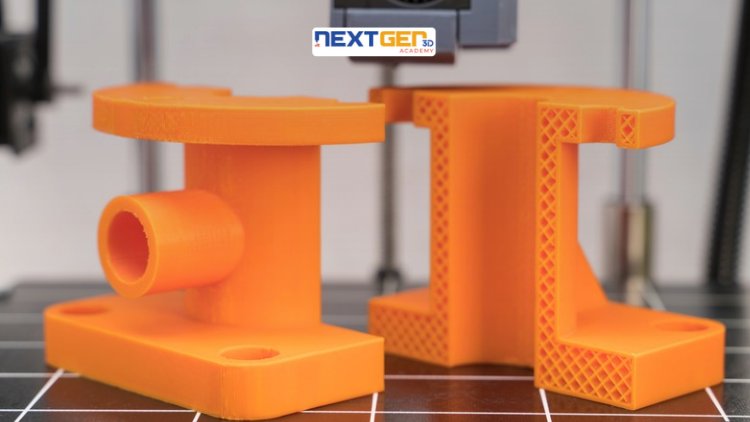
Undervisning & Akademi | Teknik
Unlock the world of 3D printing and product creation with a hands-on, industry-focused course designed to turn your ideas into reality. Whether you’re an engineer, designer, technician Masterclass.
5.0
3 tim
19 föreläsningar
Mellanliggande
$12.99

Undervisning & Akademi | Matematik
Taking Your Mastery of Probability to the Next Level
5.0
1 tim 30 min
6 föreläsningar
Alla
$9.99
$19.99
Undervisning & Akademi | Matematik
Advanced Formulas and Strategies for Cone Surface Area Determination
5.0
1 tim
10 föreläsningar
Alla
$19.99
GRATIS

Undervisning & Akademi | Aktuellt
Master all important Current Affairs from June 1–30, 2026 with daily video lectures, MCQs, exam-oriented explanations an
5.0
8 tim 30 min
29 föreläsningar
Nybörjare
$29.99
$39.99
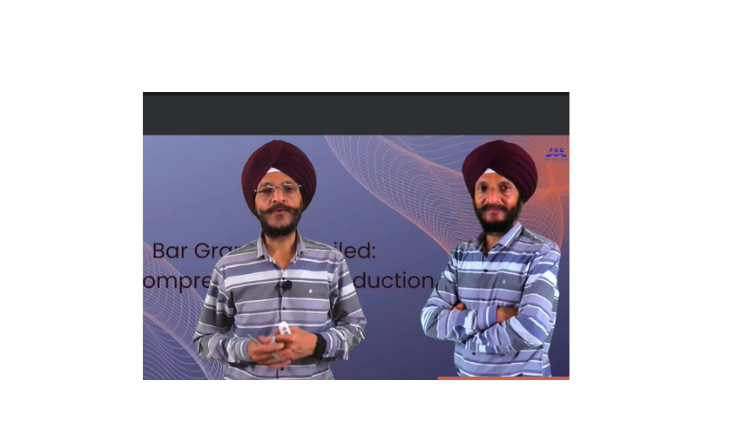
Undervisning & Akademi | Matematik
Unlocking the Power of Bar Charts for Effective Data Communication
5.0
1 tim
5 föreläsningar
Alla
$14.99
$19.99
Frequently Bought Together
Learners who enrolled in this course also frequently purchased these complementary courses together.
7-Day Money Back Guarantee for all bundle items
Total price for selected items:
$42.38
$52.97
Vanliga frågor
Hitta svar på de vanligaste frågorna om den här kursen.
Ja! När du har slutfört 100 % av kursens föreläsningar och uppgifter kan du omedelbart ladda ner ditt verifierade digitala Certificate of Completion direkt från din Lucebra-profil.
Utforska mer inom Technology
Utveckla ditt lärande med ackrediterade certifikat, e-böcker och interaktiva livelektioner.